It turns out the the Canadian financial institutions, being more carefully regulated, were not much burdened with securities that declined in value as a result of those mortgages. As an exercise, analyse the effects on the Canadian price level, monetary aggregates and money multiplier of these developments using the data in the Excel spreadsheet-file pmbsdata.xls For those who use Gretl, the Gretl data file pmbsdata.gdt is also provided.
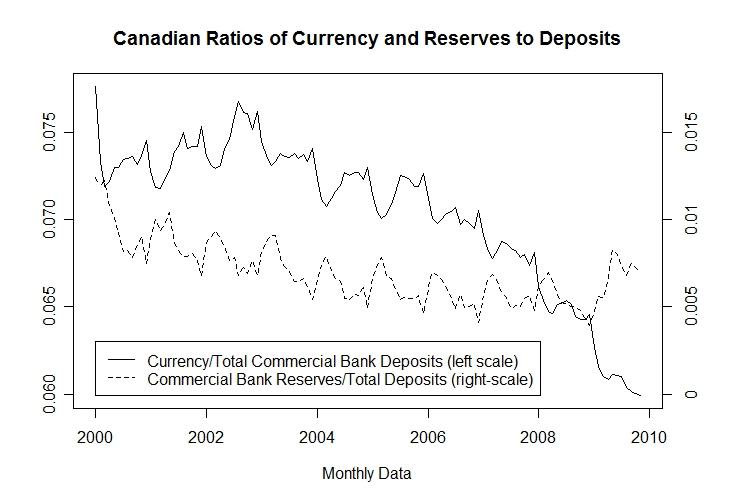
As is clear from the figure that follows, Canada's currency/deposit ratio has been declining throughout most of the decade and her reserve/deposit ratio increased, after allowing for seasonal effects, by around 25 percent during 2009. This is in contrast to the situation in the U.S. where, as noted in the previous discussion, the reserve/deposit ratio increased around 1500 percent.
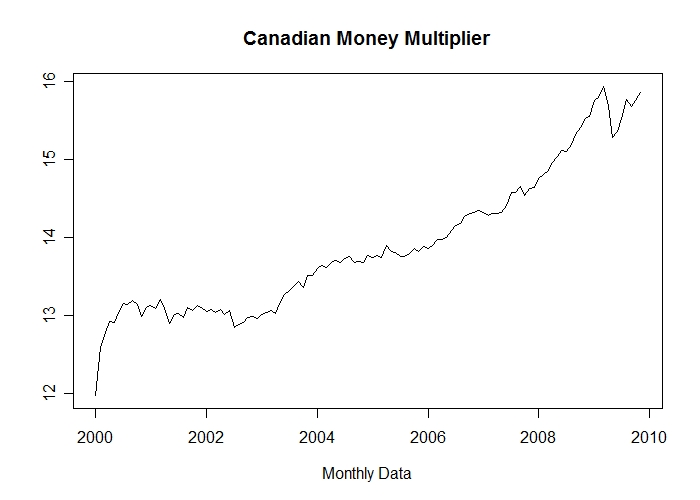
The effect of this increase in the Canadian reserve/deposit ratio on the country's money multiplier was a drop of about 5 percent between March and June 2009 with a partial recovery by the end of that year. In contrast, the U.S. money multiplier declined by nearly half its value in 2008 and did not recover.
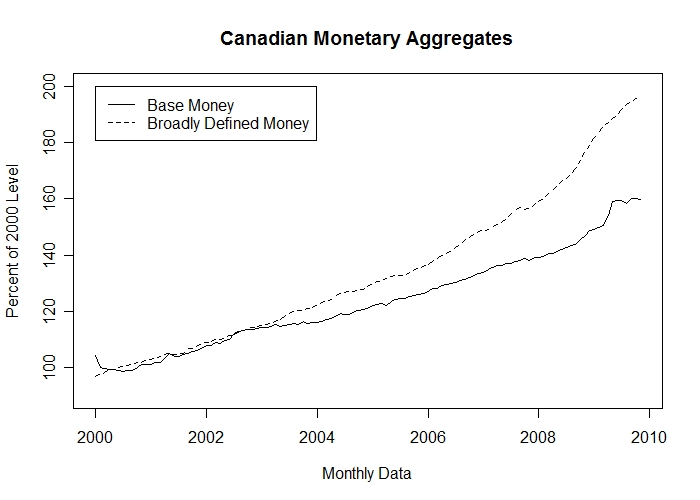
In Canada, as can be seen from the table below, base money was adjusted to offset the decline in the multiplier and the broad money aggregate increased slightly faster in late 2008 and early 2009 before returning roughly to its long-term average rate of growth.
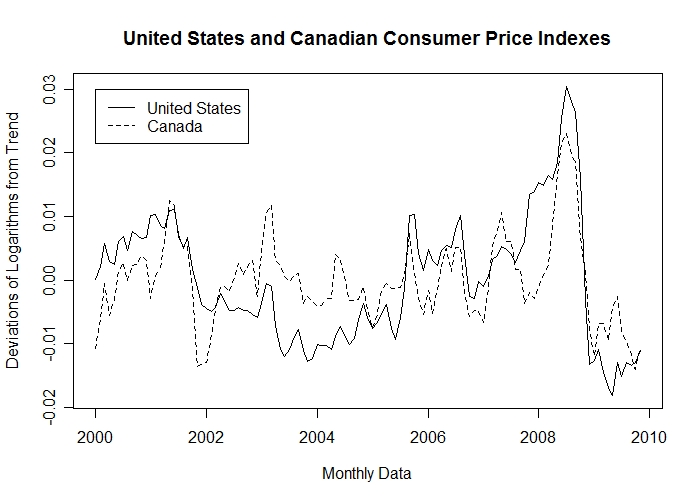
Nevertheless, as the last figure clearly shows, Canada suffered as substantial decline in her consumer price index relative to its trend in late 2008 and early 2009, although the decline was a bit smaller than that which occurred in the United States.