The biggest set of mistakes was the conduct of monetary policy
in the 1930s. And the major but not the only offender was the
United States Federal Reserve System.
At the beginning of the Great Depression, countries had conducted
independent monetary policy during the previous decade only as part of
their attempts to reestablish the gold standard after the First
World War. Those attempts broke down in the years following 1929.
After the recession of the 1930s began, a run on the commercial banks
took place in the United States. As was noted in detail in the
computer-assisted learning module Small Open Economy Equilibrium III:
Monetary Policy Under Fixed Exchange Rates, the stock of base money
equals currency in the hands of the public plus the reserves of the
banking system
H = C + R
were H is the stock of high powered money, C
is currency in circulation and R is the stock of commercial
bank reserves. The stock of money equals currency in the hands
of the public plus deposits
M = C + D
where M is the nominal money stock and D is the
stock of deposits in the commercial banks owned by the general public.
The ratio of the money stock to the monetary base---that is, the money
multiplier---thus equals
M / H = (C
+ D) / (C + R)
= (C/D + D/D) / (C/D + R/D)
= (c + 1) / (c + f)
where c equals the ratio of currency to deposits and f
equals the ratio of reserves to deposits. The run on the commercial banks
took the form of attempted complete conversions by the public of deposits in
certain banks into cash out of fear that those banks might fail. Since banks
held reserves equal to only a fraction of their deposit liabilities, such
actions of depositors caused them to run out of reserves, justifying
depositors' fears. The run became so widespread at one point that
a "bank holiday" had to be declared!
The effect of widespread fear of inabilities of banks to provide cash for
deposits can be seen from the above equation using a simple example. Suppose
that the public initially holds a ratio of currency to deposits of 0.2 and
the banks hold a reserve-to-deposit ratio of 0.2. This implies a money multiplier
of 1.2/0.4 = 3.0. Now suppose that the public, out of fear,
increases its ratio of currency to deposits to 0.5 and the commercial banks,
fearing future widespread conversions of deposits into currency, increase their
reserve ratios to 0.5. The money multiplier falls to 1.5/1.0 = 1.5,
a reduction to half its original value. Any given stock of base money will
now yield a money supply of half the magnitude it was originally.
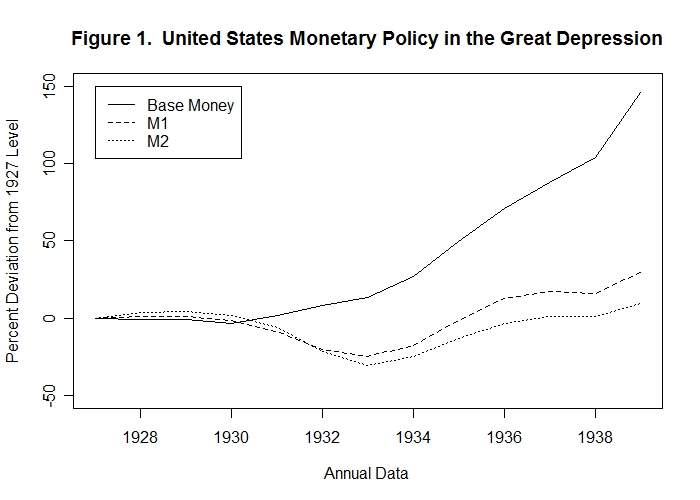
Take a look at Figure 1 below. The Federal Reserve increased the stock of
base money substantially after 1930, but not by enough to offset the decline in
the money multiplier. Both M1 and M2 had fallen by between 25 and 30 percent by
1933. This had a catastophic effect on output and employment in the United States.
Out of misplaced concern for inflation, the authorities allowed this to happen!
We now proceed to an examination of mistakes that the
monetary authorities of the major industrial countries have made
over the past seven decades. While these were mistakes,
judged by today's standards, we must keep in mind that little was
known at the time about the details of how monetary policy should
properly be conducted. We know what we know now largely because
(let us hope!) we have learned from past mistakes.
Money supply growth began to recover after 1933, but a decline occurred again in 1937 when the authorities decided to increase the required reserve ratio of commercial banks, thinking that they were simply making the increase in reserves that had already occurred a required increase. An unexpected effect was to cause the commercial banks to further increase their reserve ratios to provide a cushion of actual over required reserves as protection against any future witdrawl of deposits by the public. The resulting downward effect on the money multiplier further extended the Great Depression.
The U.S. Federal Reserve was not the only monetary authority to make mistakes. The time paths of the Canadian monetary base and the money stock are shown below in Figure 2. There were no abnormal conversions of currency into deposits or bank failures in Canada and hence no major change in the country's money multiplier. But the Canadian authorities reduced base money, thereby creating a decline in the domestic money stock equivalent to that in the United States and fully extending the Great Depression northward into Canada.
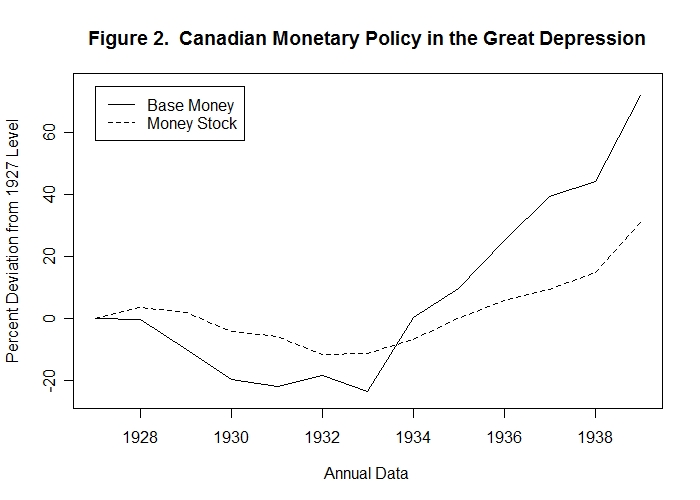
Why did the Canadian authorities do this? Here it should be noted that Canada had no central bank until the formation of the Bank of Canada in 1935. Up to that time, monetary policy was conducted by the Department of Finance. An obvious possible reason why base money declined in Canada was a desire to maintain a fixed exchange rate with respect to the United States, in which case Canada could have no independent monetary policy---the tendency of the Canadian dollar to devalue in terms of the U.S. dollar as a result of the U.S. contraction would automatically result in a sale of foreign exchange reserves by the Canadian authorities in return for domestic currency, leading to a similar contraction in Canada. It turns out, however, that the Canadian dollar was allowed to devalue quite substantially between 1930 and 1933. The Canadian dollar price of the U.S. dollar for the period 1929 through 1937 was as follows:
| 1929 | 1930 | 1931 | 1932 | 1933 | 1934 | 1935 | 1936 | 1937 |
| 1.00 | 1.00 | 1.04 | 1.14 | 1.09 | .99 | 1.01 | 1.00 | 1.00 |
The fact that devaluation was allowed indicates that their was no committment to fix the exchange rate. The problem is that the authorities did not allow the dollar to devalue sufficiently to permit the domestic monetary expansion necessary to maintain full employment. A judgment was probably made that a devaluation in excess of 15 was inconsistent with maintaining an "orderly" foreign exchange market.
Since the Great Depression was world wide, it is probably the case that the other major industrial countries followed policies similar to the Canadian one. The monetary contraction became world wide because of an unwillingess of other countries to allow major depreciations of their currencies with respect to the U.S. dollar. An attempt to verify this conclusion by examining the monetary aggregates for these other countries would be an important empirical excercise.
With the run-up to and onset of World War II, the Great Depression disappeared and was replaced by monetary expansion and inflationary finance of the war effort. This inflation was eventually brought under control in the late 1940s and world monetary policy was organized around the International Monetary Fund which was founded to avoid repetition of the beggar-thy-neighbor policies and monetary instability of the inter-war period. This Bretton-Woods system of fixed exchange rates was essentially a key-currency system with the United States dollar as the key-currency to which all other countries pegged their exchange rates. And the United States tied its dollar to gold in the sense that it was prepared to buy and sell gold for 35 dollars per ounce. By implication, all other currencies were also tied to gold. Because of this relationship between the dollar and other currencies and gold, the new system was widely viewed as a re-establishment of the gold standard. It was not a true gold standard, however, because there was no relationship between the quantity of gold and the quantities of money in the U.S. or abroad. It was a key-currency standard in which the price of gold was fixed in terms of the key currency. But monetary policy in the key currency country was independent of that country's gold holdings and the monetary policies of all other countries were tied to U.S. monetary policy through their imposition of fixed exchange rates with respect to the U.S. dollar. Although tariffs and import restrictions and other trade diversionary tactics were rather quickly eliminated under the Bretton-Woods system, controls over capital movements were allowed when needed to prevent disorder in foreign exchange markets. Countries were able to use these controls to attempt to manipulate their real exchange rates with the U.S. dollar and in the case of "fundamental disequilibria" adjustments of the nominal exchange rate parities were allowed. Nevertheless, as capital markets improved it became increasingly difficult for countries to control capital movements and maintain nominal exchange rates at their fixed levels in the face of underlying equilibrium real exchange rate movements and desired differences between the domestic and U.S. inflation rates. And as real incomes and the real volume of international trade grew, the world gold stock became a smaller and smaller fraction of the total stock of key-currency reserves, leading to speculation that the U.S. dollar price of gold would eventually have to be increased. Such speculative pressures eventually led in 1968 to a two-price system for gold---an official price of 35 dollars per ounce at which central banks exchanged gold reserves and a higher market price at which private individuals traded gold. In 1971 the attempts of other central banks to accumulate gold led the U.S. to announce that it would no longer buy or sell gold from anyone at 35 dollars per ounce. The resulting Smithsonian Agreement that December raised the price at which the U.S. would not buy or sell gold from 35 to 44 dollars per ounce, changed the exchange rates at which other countries were pegging their currencies to the dollar and established wider bands within which these new fixed exchange rates must be maintained. But this effort proved unsuccessful and the fixed exchange rate system was essentially abandoned by 1974.
An important factor that led to the ultimate abandonment of the Bretton-Woods system was the increase in U.S. inflation in the late 1960s and early 1970s which countries like Germany did not want to match. Figures 3a and 3b present the deviations of the logarithmic levels of the United States monetary aggregates and consumer price index from their trends. By taking logarithms and detrending we are able to get a better sense of the nature of ongoing monetary policy than was possible by looking at actual levels, which are dominated by trends, or at percentage changes which, as noted in the previous Topic, differ widely and incomprehensively across aggregates. It turns out that the rate of change of the consumer price index along its trend was about 2 percent per year so a horizontal movement of that variable on the charts implies roughly a 2 percent inflation rate.
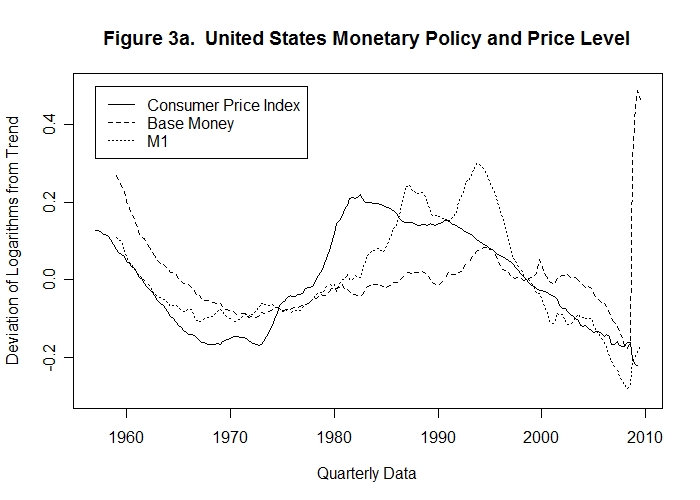
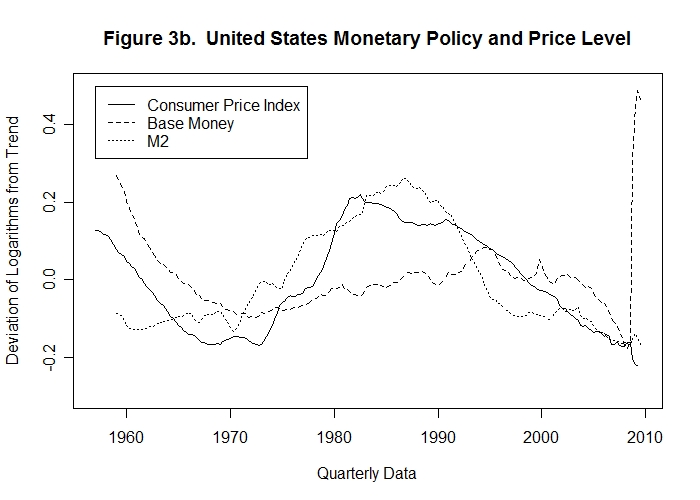
The solid lines in the two figures present the deviation of the logarithm of the consumer price from its trend and the dashed lines present the deviation of the logarithm of base money from its trend. The dotted line in Figure 3a shows the deviation of the logarithm of M1 from its trend and the dotted line in Figure 3b gives the deviation of the logarithm of M2 from its trend.
It is clear from the two figures that the Federal Reserve substantially increased the average rate of growth of base money in the late 1960s and maintained that greater degree of monetary growth until the mid-1990s after which base money growth was increasingly reduced until around 2007. The consumer price index began to increase more rapidly about the same time as base money growth changed and grew much more sharply than base money until the early 1980s, after which its growth declined until the mid-1990s and after a temporary reversal declined permanently to late-2009. The decline more or less matched the decline in the growth of base money after the mid-1990s. Of particular interest is the fact that the CPI grew very sharply and then declined very sharply relative to base money until the mid-1990s. At the same time, the pattern of movement of M2 in Figure 3b was quite close to that of the CPI with M2 leading the CPI until 1980 and then lagging behind it thereafter. U.S. M1 also shows a pattern more comparable to that of the CPI than base money, though it clearly lags behind the CPI. As in the Great Depression, money multiplier changes had an important influence on the extent of U.S. inflation during the period. And the Federal Reserve System, as in the Great Depression, failed to compensate for those money multiplier changes by adjusting base money growth. Of course, this mistake came on top of the more fundamental error of changing base money growth and thereby causing increased inflation in the first place.
Why did CPI turn down much before the turnaround in base money growth and M1 growth? A final answer to this question awaits further investigation, but a likely candidate is the deregulation of the U.S. financial system in the early 1980s which would seem to have reduced the costs of holding money, thereby increasing the demand for it relative to the existing supply. But eventually the Federal Reserve System correctly tightened base money growth to ensure an end to the preceding major bout of inflation. Although mistakes were made, the consequences were far less drastic than, and in the opposite direction to, those resulting from the mistakes of the 1930s.
Notice now from Figures 4a and 4b that the Canadian authorities adjusted the domestic stock of base money to finance movements in the Canadian consumer price index parallel to those in the United States and, as in the 1930s, there were no changes in the Canadian money multiplier similar to those in the U.S. These series are also deviations of the logarithms of the variables from trend.
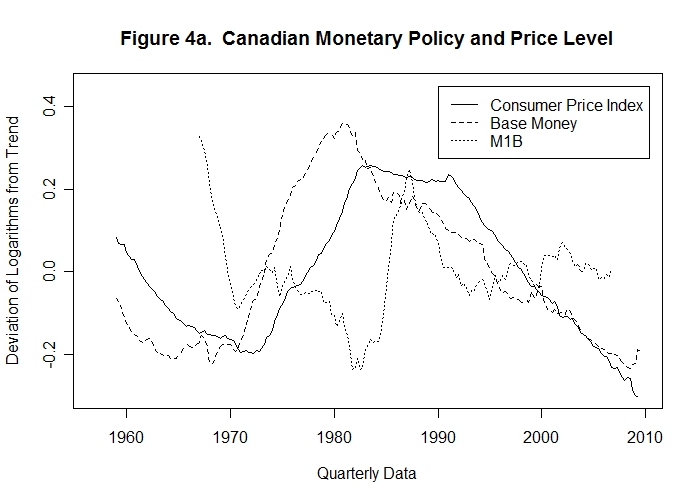
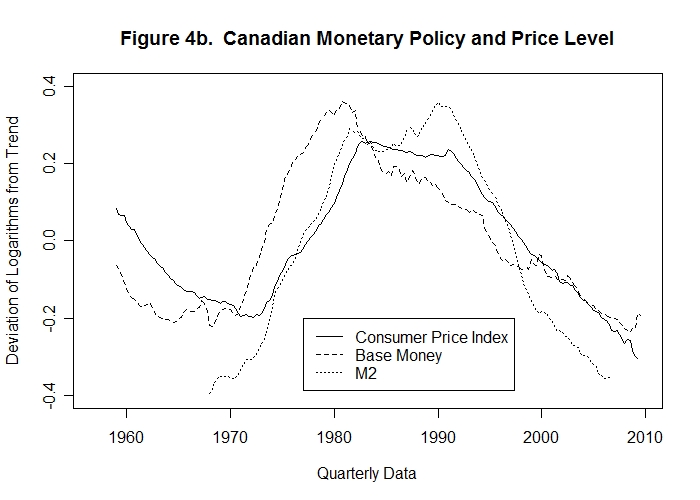
Canadian base money led the movements in Canada's CPI and movements in her M2 aggregate closely matched those CPI movements in Figure 4b. While the M1 aggregate increased during the period when the CPI was higher relative to its trend the correspondence of the two variables in Figure 4a is poor. Even though Canada's exchange rate with respect to the U.S. was floating after 1971, the Bank of Canada followed essentially the same monetary policy as was conducted in the United States, making the same mistakes as were made by the Federal Reserve System.
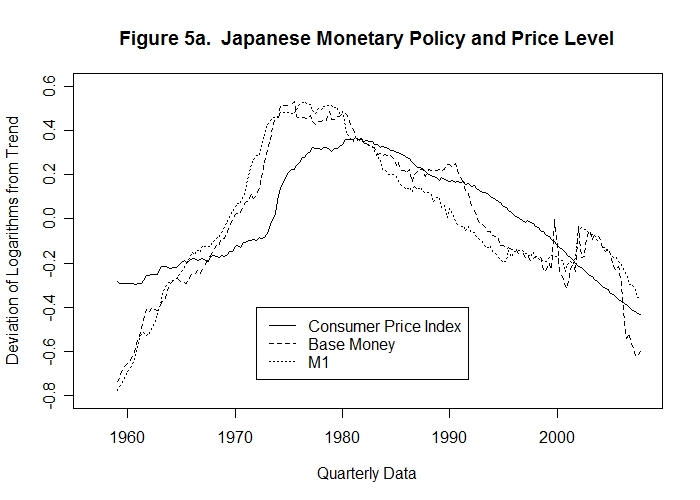
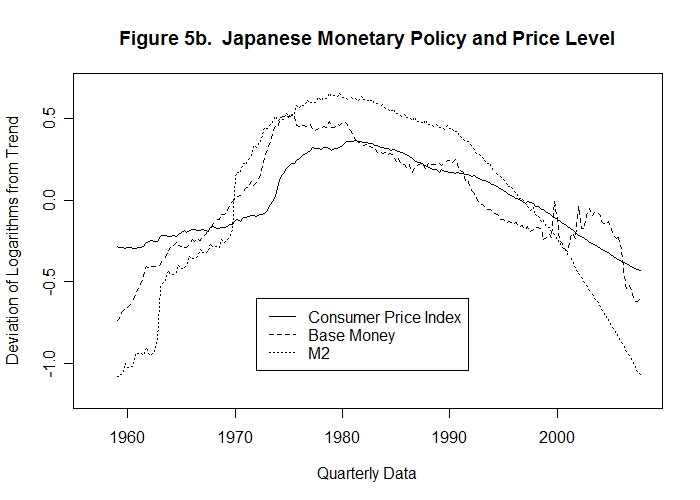
As is obvious from Figures 5a and 5b, which plot the deviations of the logarithms of the same variables from trend, the same monetary policies were followed by Japan even though it also experienced no changes in its money multipliers.
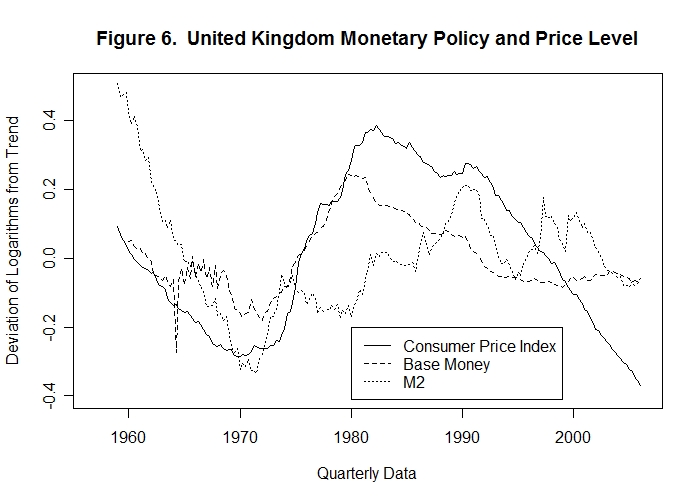
Finally Figure 6 plots the deviations of the logarithms of British base money and M2 from trend. Although the movements of the British monetary base can explain the pattern of movement of the consumer price index, both those variables are poorly related to the movements of British M2. The pattern of movement of the CPI in the United Kingdom is strikingly similar to the pattern of movement of the U.S. CPI.
Traditionally, the United States authorities have failed to adjust base money to compensate for changes in the money multiplier while the authorities in the other countries examined adjusted their base money aggregates to finance domestically the same pattern of inflation that occurred in the United States. The question immediately arises as to whether the United States Federal Reserve System is making the same mistakes during the financial crises of 2007-2009 as they did in the Great Depression and the Post-Bretton-Woods inflation. Figures 7, 8 and 9 address this issue.
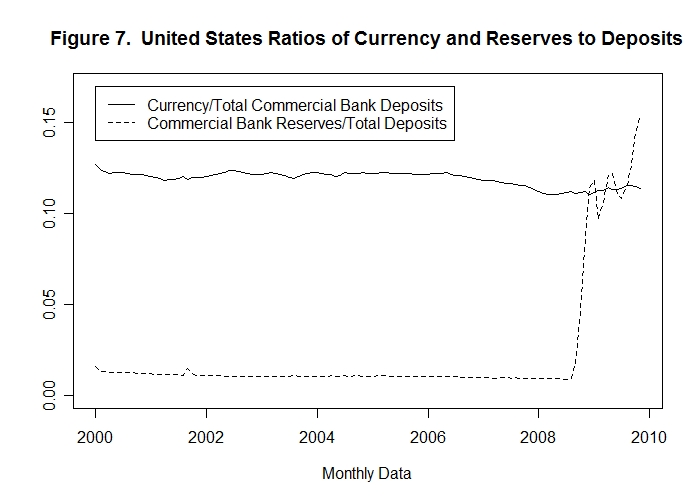
Figure 7 clearly indicates that the ratio of commercial bank reserves to deposits increased enormously from around 0.0095 in August 2008 to more than .15 in November 2009, an increase of 1500 percent! Very little change occured in the ratio of currency in circulation to commercial bank deposits. As a result of the reserve/deposit ratio changes, both the M1 and M2 multipliers had declined by about half their August 2008 levels by November 2009, as can be seen from Figure 8 below.
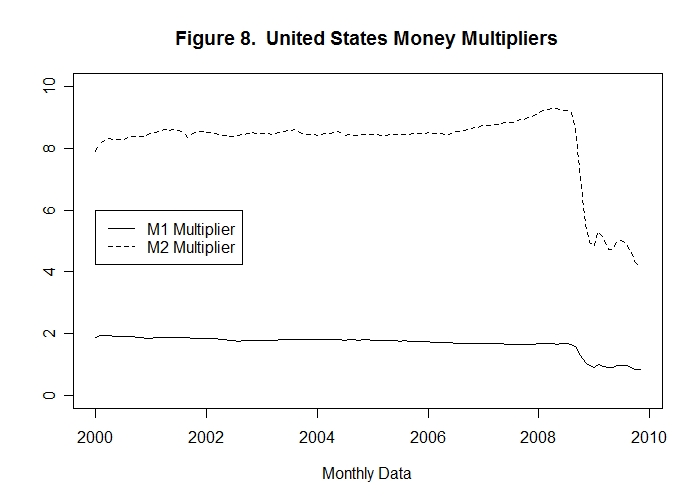
Figure 9 plots the stocks of base money, M1 and M2 as percentages of their year-2000 levels. It is obvious that Ben Bernanke, who had a distinguished career as an academic research economist, studying the Great Depression as well as other things, before his appointment as Chairman of the Federal Reserve System is not going to repeat past mistakes!
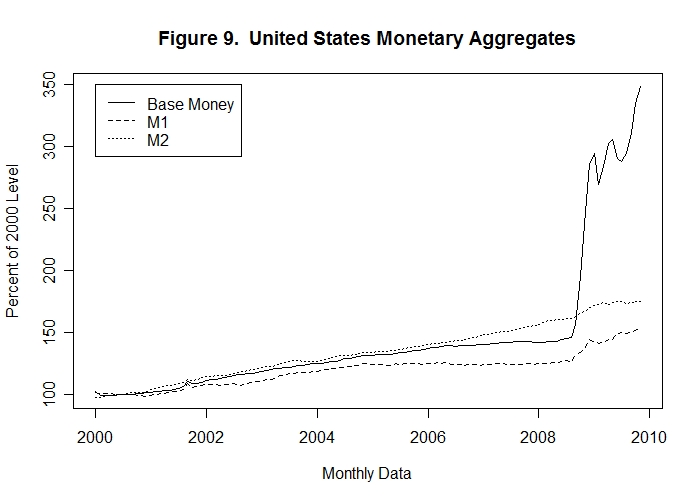
The monetary base increased by about 240 percent of its year-2000 level between January 2007 and November 2009 with nearly all the increase occurring after August 2008. Although their increases may seem small on the graph, M1 and M2 increased about 22 percent and 18 percent, respectively, over the whole period. Most of the increase in M1 also occurred after August 2008, while the increase in M2 was more uniform although still larger during the final 15 months.
Of course, the question that immediately arises is whether these increases the the monetary aggregates were excessive and will lead to another big inflation episode in future years. The Federal Reserve probably made a calculated decision to absorb a risk of future inflation in order to make sure that there would not be another Great Depression! Was this a wise decision? We will know the answer in three or four years!
It is test time again. In this case, however, we replace the first two tests with exercises which you should work through before looking at the solutions here presented.
Question 1
Question 2
Question 3
Choose Another Topic in the Lesson.