how to create good-looking figures for a latex document
author
introduction
By "good-looking" I mean
- the font for any text in the figures is the same as the font for the text of the article
- labels are consistently aligned relative to the objects to which they refer
- lines that are meant to be smooth are in fact smooth
- any shading exactly fills the areas it is supposed to fill
- plots of specific functions are accurate, not hand-drawn rough approximations.
In other words, good-looking figures are unlike many of the figures that appear in most economics journals. (Theoretical Economics is, of course, an exception.)
Creating good-looking figures for a LaTeX document is not difficult, mainly due to the existence of PSTricks and TikZ. I have used only PSTricks (which was developed much earlier than TikZ), and that is the system I discuss on this page.
Here's an algorithm.
- Create a PSTricks LaTeX file for the figure.
- Produce an encapsulated pdf file from the LaTeX code.
- Insert an
\includegraphicscommand in your LaTeX document that refers to the pdf file.
If you do not have BaKoMa and do not possess an extraordinary ability to visualize the output of PSTricks code, you'll need compile and view your file repeatedly to make it look the way you want it. In the absence of BaKoMa, you'll also probably have to execute step 2 in the following somewhat roundabout fashion.
- Compile the TeX file and output it as Postscript (PS).
- Convert the PS file to Encapsulated Postscript (EPS).
- Convert the EPS file to pdf.
- Any text editor can create and edit a TeX file. TeXstudio is well-suited to TeX.
Rather than creating your figure in a separate file, you can include the PSTricks code directly in the file for your article. However, if you do so you will not be able to use pdftex to process your article, which means you will not be able to take advantage of the magic of the hyperref package.
details
- Creating the PSTricks file is what takes the time. Here is the template of a suitable file.
The easiest way to learn how to write the PSTricks code is to find an example that is similar to the figure you want to create. Here's a simple example.\documentclass[11pt]{article} \usepackage{pstricks} \pagestyle{empty} \begin{document} \color{white} %\color{black} % activate to see bounding box \fboxsep=0pt \fbox{% \psset{unit=1mm} \color{black} % for text % this figure is 50mm by 50mm \begin{pspicture}(0,0)(50,50) <PSTricks code> \end{pspicture} } \end{document}
If you substitute that for the string <PSTricks code> in the template and open the resulting file in BaKoMa TeX Word, you'll instantly see the following figure.% axes \psline(5,50)(5,5)(50,5) % label on y-axis, with the top right at (4,50) \rput[tr](4,50){\shortstack{$\uparrow$\\$y$}} % label on x-axis, with the right of the baseline at (50,0) \rput[Br](50,0){$x\rightarrow$} % a curve \pscurve(5,10)(20,40)(50,5)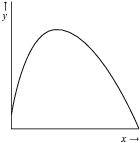
For the full range of capabilities of PSTricks, see the PSTricks manual or Chapter 4 of The LaTeX Graphics Companion (ISBN-13: 978-0-321-50892-8).
- You now have to create an encapsulated pdf file. (That is, a pdf file with the dimensions of your figure, not the dimensions of a full page.)
In BaKoMa, this step is trivial: choose File -> Export -> Postscript (DVIPS) ... and then check the box labeled "Create EPSF" and click "Generate". In a few seconds, an encapsulated pdf file will be created.
If you're using another editor, you'll probably need to go through three steps.
- Produce a Postscript file from your LaTeX code. In the TeXnicCenter, for example, choose LaTeX => PS in the drop-down menu at the top of the screen, then "build" the file (Ctrl-F7).
- Open the Postscript file in Ghostview and choose File -> PS to EPS -> Yes. Give the file an eps extension.
- Open the eps file in eps2pdf and click "Convert".
- At the appropriate place in your article, include code along the following lines.
\begin{figure}[htb]
\hspace*{\fill}
\includegraphics{<filename>.pdf}
\hspace*{\fill}
\caption[]{<Your caption>}\label{<Your label>}
\end{figure}