References to supply and demand are commonplace among
non-economists---people are often heard to say that the price of
some product went up because demand increased or because supply
was short. Less commonly we hear it said that demand for some
product has increased because that good has become cheaper.
Many times when we attempt to discuss some particular issue
we receive the response "Oh! I know! It's simply a question
of supply and demand".
Casual supply and demand analysis of this sort tends to be
loose and unfocussed, raising more questions than it answers.
For example, if the demand for a commodity increases because the
price falls, why wouldn't this increase in demand cause the
price to be bid back up, negating the original fall in price?
Does an increase in demand always cause the price to rise? Or
might it call forth additional supply without a price increase?
How can we determine whether an increase in price is caused by
an increase in demand or a decrease in supply?
To deal with these complexities economists have developed
some analytical tools involving the use of graphical and, for
more advanced problems, mathematical analysis.
Let us begin by forcing ourselves to categorize all forces
affecting the prices of individual commodities (by prices we
mean the amounts of money one must give up to buy them) as
operating through either the demand for the commodity by buyers
or the supply of the commodity offered by sellers. We can think
of a market is an institutional arrangement through which buyers
and sellers get together--it may be associated with a particular
place (e.g., the farmers' market or the stock exchange) or it may
be represented by a world-wide network of retail establishments
or sales representatives.
Consider the market for fresh milk in a particular area.
Imagine that, with everything else staying the same, the price
of fresh milk falls. We would expect consumers to want to buy
more milk at lower prices because milk is now cheaper in comparison
to orange juice, soft drinks, and other fluids that people
typically consume, and is now a cheaper ingredient to use in
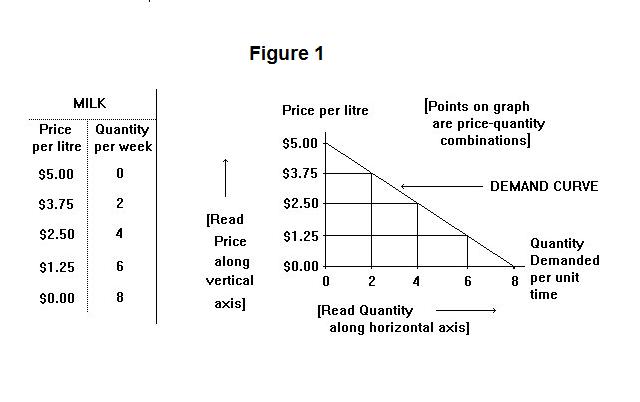
cooking. Suppose that the relationship between the price of milk
and the quantity demanded in the market is as follows:
| Price | Quantity per week |
| (per litre) | (millions of litres) |
| $5.00 | 0 |
| $3.75 | 2 |
| $2.50 | 4 |
| $1.25 | 6 |
| $0.00 | 8 |
Notice that as the price falls the quantity demanded increases. This relationship is shown graphically in Figure 1.
The price-quantity combinations are plotted on a standard cartesian coordinate system. The quantity demanded (in millions of litres) is read along the horizontal axis and the price per litre is read along the vertical one. Each price-quantity combination in the table on the left (which is identical to the one above) is shown as a point on the graph---the prices are projected to the right from the vertical axis and the associated quantities are projected upward from the horizontal axis.
The curve that connects all these price-quantity combinations is called the demand curve (which, in the present instance happens to be a straight line). It is negatively sloped because quantity goes up and price goes down as we move to the right along the curve. This corresponds, of course, to the relationship between price and quantity in the table.
Now let us consider how the quantity supplied by producers of milk might be affected by the market price of milk. Milk producers have to receive a price that covers their costs. Thus, there will be some minimum price--say $1.25--below which no milk will be supplied. As farmers expand their herds to increase milk production, greater demands are placed on the capacity of the land to produce feed for the cows. Feed costs rise. An expansion of milk production therefore increases farmers' costs. It therefore requires higher and higher prices to induce them to produce larger and larger quantities.
| Price | Quantity per week |
| (per litre) | (millions of litres) |
| $1.25 | 0 |
| $2.50 | 4 |
| $3.75 | 8 |
| $5.00 | 12 |
As the price increases, so does the quantity supplied. This relationship is shown graphically in Figure 2.
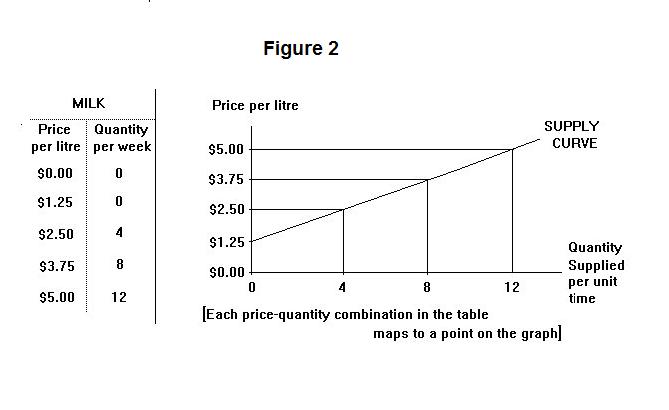
Again, each price-quantity combination in the table on the left maps to a point on the graph, with the distance of the point from the horizontal axis being determined by the price and the distance from the vertical axis being determined by the quantity. The points on the graph corresponding to the combinations of price and quantity in the table join together to form an upward sloping curve (in this case, line) called the supply curve. This curve traces out the quantity suppliers will supply at various prices.
Now let us put the demand and supply curves both on the same graph in order to study the combined influences of demand and supply in determining the market price. This is done in Figure 3. Notice that the two curves cross at a price per litre of $2.50 and a quantity of 4 million litres.
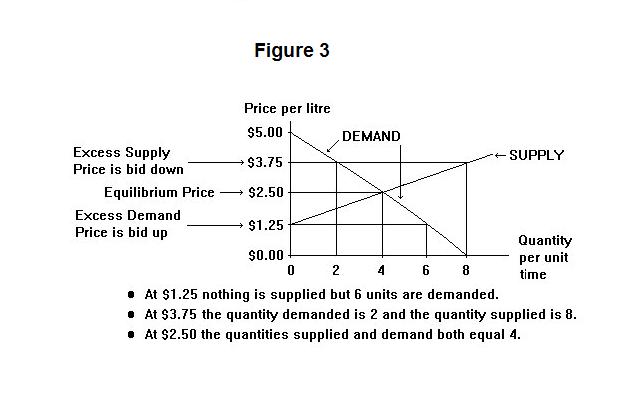
Suppose that the price happens to be $3.75. The quantity demanded by consumers would be 2 million litres, while producers will want to produce 8 million litres at that price. There will be an excess supply of milk coming on the market and the price will be bid down. As the price falls the quantity demanded will increase and the quantity supplied will fall. This downward adjustment of the price will continue until the quantity demanded and the quantity supplied are the same and the excess supply has been eliminated.
Alternatively, suppose that the price happens to be $1.25. At that price, producers won't produce any milk at all while consumers will want to consume 6 million litres. There will be excess demand for milk and the market price will be bid up. As it rises producers will begin to produce milk and consumers will cut back on the quantity they demand. The price will rise until the excess of the quantity demanded over the quantity supplied has been reduced to zero.
The equilibrium price will be $2.50. We say that that price is the equilibrium one because if the price is $2.50 there will be no market pressure on it to either rise or fall. If the price is above $2.50 there will be excess supply and downward pressure on it. If it is below $2.50 there will be excess demand and upward pressure. At $2.50 there will be neither excess demand nor excess supply and hence no pressure for the price to change.
It is now time for a test on this topic. Before looking at the answer provided you should think up an answer of your own.
Question 1
Question 2
Question 3
Choose Another Topic in the Lesson.