Measuring economic magnitudes in this way, however, poses some serious
problems. In 1961, a Volkswagen Beetle cost less than $2000. Does this
mean that today's Beetle is more than 10 times as valuable as the 1961 version?
One could buy an 8 oz bottle of Coke in 1951 for 7 cents. Has that product
improved?
It turns out that the amount of goods that a unit of money will buy
has declined dramatically over the past few decades. That is, the
prices of things in terms of money have gone up---in fact, risen on
average nearly eight-fold since the late 1950s. If we want to
compare economic magnitudes at different points in time we have to
correct for this or much of what we say will be nonsense.
This leads us to make a distinction between real and nominal
or money magnitudes---for example, between real and nominal gross domestic
product. How do we measure real magnitudes?
In the case of a commodity like wheat the obvious thing to do is
measure it in bushels. But in the case of income aggregates or
prices a monetary measure must be used. Apples and oranges can
only be added together after expressing them in terms of some common
unit---in this case, their money values.
An appropriate way to measure real magnitudes is in terms
of their value in some previous year's dollars. The price of
the bundle of goods that made up Canada's GDP in 1980 had
risen nearly 100 percent by the year 2000. One dollar in 2000 was
therefore worth a bit more than 50 cents in terms of what a dollar would
buy in 1980. We can thus calculate year 2000 GDP in 1980
dollars by dividing the year 2000 figure for nominal GDP by a bit less
than 2. According to this measure, real GNP in 2000 was around $500
billion, measured in 1980 dollars, while nominal GDP in the year
2000 (that is GDP in 2000 measured in 2000 dollars) was a bit over
1 trillion.
The amount of money required to buy a bundle of goods in
any given year is called the price level. Since it took about twice
as many dollars in the year 2000 to buy the bundle of goods produced
in the Canadian economy in 1980, the price level in Canada rose
around 100 percent. But any measure of the price level depends
critically on the particular bundle of goods chosen. The percentage
increase in the level of prices of goods purchased by workers in
Toronto will be different than percentage increase in the price
level of goods produced in the whole economy because those workers
will consume a different mix of goods than the economy produces. This
in turn will be different than the percentage increase in the price
level of the bundle of goods produced by farms in Saskatchewan, and so
forth.
So we convert nominal magnitudes into corresponding real magnitudes
by dividing them by a relevant price level. We have to use the word
relevant here because there are many different possible price levels
that we could use in any given situation---judgment is required in
deciding which one to use.
How do we measure the price level? Quite apart from the issue of what
bundle of goods to use in defining it, there is the question of units.
If we were to define the price level in 1980 as the dollar value of a
bundle of goods, such as for example, GDP in 1980, the price level would
be some number like $302 billion. We could alternatively define the
price level as the price of an average good, but what is an average good?
This problem of units disappears when we view the price
level as a relative concept---that is, as the money value of a basket
of goods now relative to the money value of the same basket of
goods at some previous point in time. If we are using 1980 as the
basis of comparison, we arbitrarily fix the price level in that
year at 100. If this year's price of that basket of goods is, say, 65
percent higher, today's price level will be 165---the price level will
have risen since 1980 by 65 percent.
The monetary unit or unit of account in our earlier discussion provides
a convenient yardstick for measuring economic magnitudes. To give some
examples, in 2008 Canada's Gross Domestic Product was 1.6 trillion dollars,
a Volkswagen Beetle now costs more than $20,000 and a can of Coke costs about a
dollar. The figures given in the case of the two commodities are their prices
in exchange for money. In the case of Canadian GDP, $1.6 trillion is a measure
of the aggregate dollars-worth of final goods and services that the Canadian
economy produces.
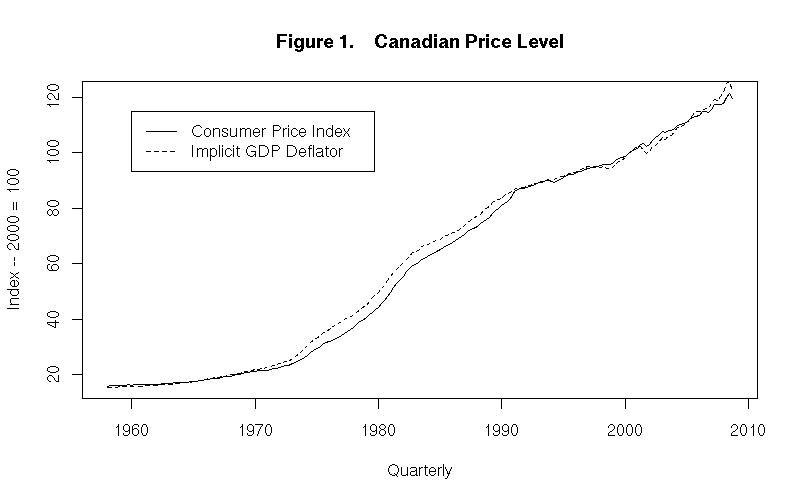
Figure 1, plots Canada's price level according to two different measures. One is the implicit GDP deflator, given by the dotted line in the chart. The other is the consumer price index, given by the solid line. The implicit GDP deflator is calculated in the following way. First, separate measures of nominal GDP and real GDP are obtained for every year---the nominal measures will be in that year's dollars and the real measures will be in the dollars of some particular year which can be called the base year. We now divide the nominal GDP series by the real GDP series and then multiply the resulting series by 100 so that its value in the base year will be 100, not 1.0 as would otherwise have been the case.
As you can see from the graph, the value of the implicit GDP deflator in the year 2000 averages out to 100. This price index gives the movements in the price level of the bundle of goods that constitutes domestic output. It is called the implicit GDP deflator because it is the price index that deflates nominal GDP into real GDP.
The consumer price index (CPI) in Figure 1, described by the solid line, is also on a base of 2000 = 100. This series gives the current level of the prices of the bundle of goods that the average person in the economy consumes, taken as a percentage of the level the prices of those goods in the base year 2000. As you will note from viewing the figure, the two different measures of the price level track each other quite closely. In 1958, for example, the implicit GDP deflator was 16.34 and the consumer price index was 15.74. At the end of 2008, the implicit GDP deflator was 122.3 and the CPI was 119.5. Together they indicate that the price level increased by a multiple of about 122.3/16.34 = 7.5 or 119.5/15.74 = 7.6, depending upon the measure we use. This means that things that cost, on average, $1 in 1958 would cost close to $8 at the beginning of 2009.
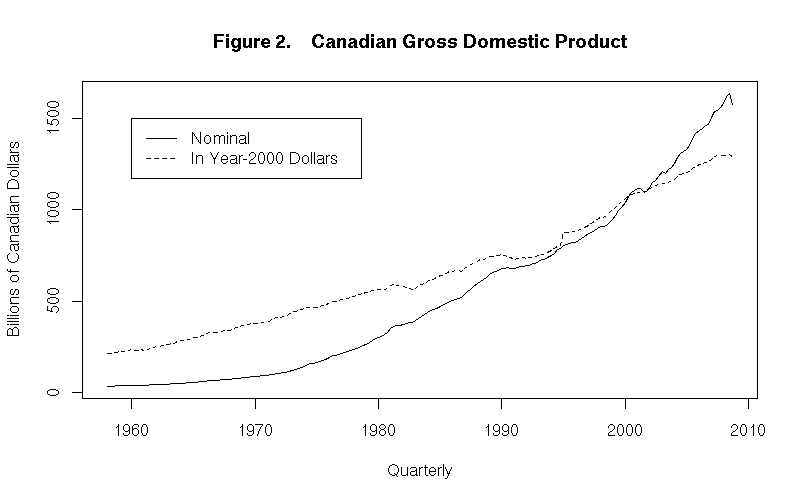
Consider another example. Figure 2 plots Canada's real and nominal GDP from 1958 through 2008. Since real GDP is measured in year-2000 dollars, it equals nominal GDP on average in that year. Real GDP is below nominal GDP in 2008 because the price level has risen between 2000 and 2008---one 2008 dollar is worth less than one year-2000 dollar so real GDP has risen by less than would be indicated from looking only at current dollar GDP figures. In 1990, the real GDP series is above the nominal GDP series because the price level was lower in 1990 than in 2000---one year-2000 dollar is worth less than one 1990 dollar. As we look backward from 2000, real output declines less than would be indicated by the nominal GDP figures because current dollars are worth more as we go backward in time.
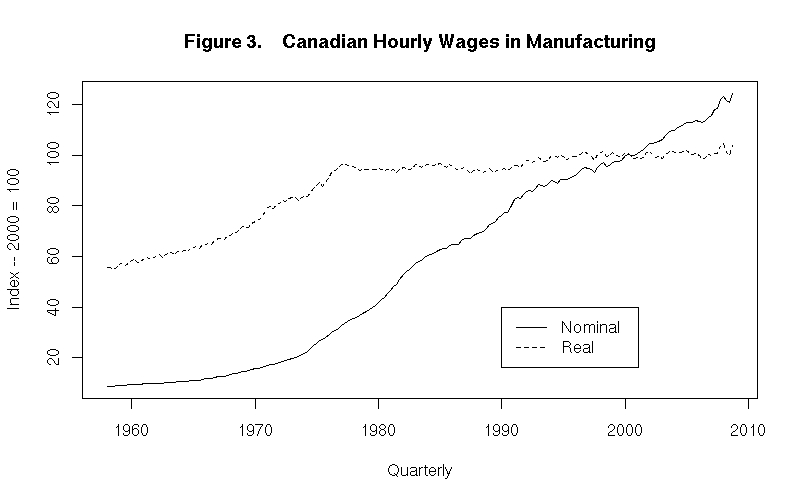
Figure 3 plots hourly real and nominal wages in Canadian manufacturing. Again the base is year 2000 = 100. Real wages are obtained from the nominal wage series by deflating the latter by (that is, dividing it by) the consumer price index and then multiplying the resulting series by 100. The CPI is a reasonable price index to use in calculating real wages because it represents the price of the bundle of goods the average person consumes. Nominal wages, given by the solid line, rose continually over the whole period 1958 through 2008. Real wages rose until about 1978 and then flattened out.
The above plot suggests that real wages in Canadian manufacturing hardly increased at all during the past 30 years. Could this really be true? Do wages in manufacturing behave in the same way as the returns to labor (that is, to human capital) in the economy in general? These data would suggest that workers in a significant part of the economy did not share in the overall increase in real income generated since the late 1970s. Or is there something unusual about this data? If real wages have not increased, then why? This is an example of how looking at some data can stimulate one's thinking and lead to further investigation. A thought that comes to mind is that, perhaps, the amount of human capital needed by a worker to do manufacturing work has not increased during the last 30 years whereas the amount of human capital per worker elsewhere in the economy has, on average, increased substantially. So increasingly below-average trained workers tend to be hired in manufacturing as the the economy grows.
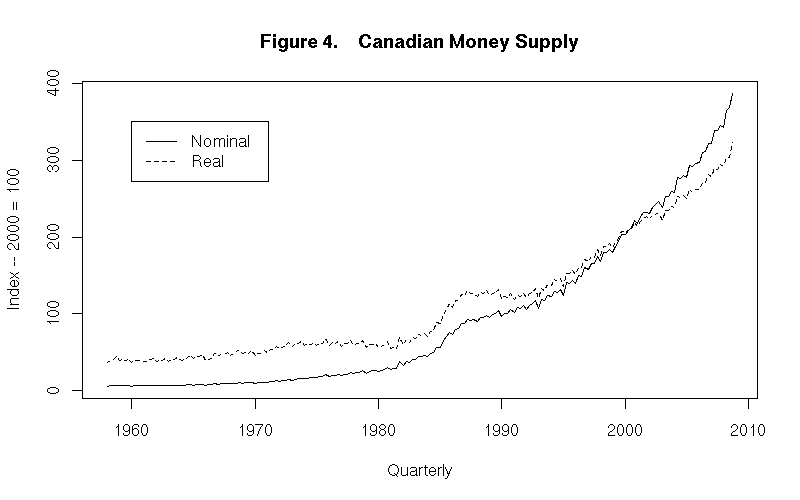
As a final example, consider the real and nominal money supplies, shown in Figure 4. Here we are measuring the money supply as cash in hand plus demand deposits in banks. (As noted earlier, other measures of the money supply are possible.) The real money supply is an important aggregate because we would expect people to make decisions about how much money to hold based on the real value of money, not its nominal value. When a soft drink cost 10 cents and a hamburger 35 cents, ten dollars might have been a reasonable amount of money to keep in one's wallet and a couple of hundred dollars would have been a substantial chequing account balance. When a soft drink costs $1 and a hamburger $5, as they do now, a hundred dollars would be a more adequate inventory of cash on hand and several hundred dollars would be a reasonable chequing account balance.
As indicated by the dotted line in Figure 4, both real and nominal money holdings (according to the particular measure we are using here) increased much more rapidly after the early 1980s than before. And, of course, nominal money holdings increased faster than real holdings, as was the case with nominal and real GDP, because the price level was continually rising.
It's test time again. Construct your own answers before looking at the ones given.
Question 1
Question 2
Question 3
Choose Another Topic in the Lesson