In the previous discussion we have used the demand curve to represent
market demand---that is, the demand for the commodity in question on
the part of all buyers taken together. It is now time to consider the
relationship between the market demand and the demands of the individual
buyers in that market.
The relationship between the demand curves of individual
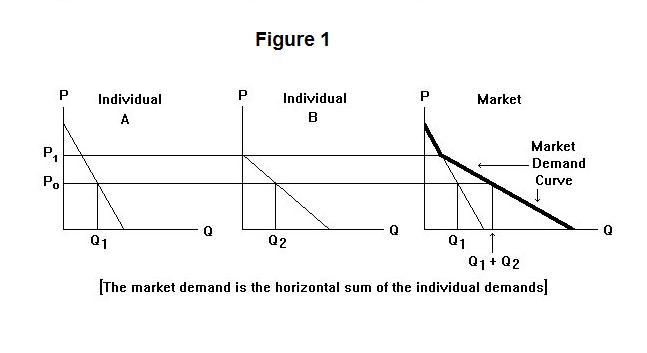
buyers and the market demand curve is shown in Figure 1. In
that figure we suppose, for the sake of argument, that there are
only two buyers in the market--Individual A and Individual B.
Each of these individuals will choose to purchase a particular
quantity at each possible price. To find the total market
demand at each price we simply add together the quantities
demanded by the two individuals at that price.
For example, the quantity demanded by Individual A at price P0 in the Figure is Q1 and the quantity demanded by Individual B is Q2. The quantity demanded in the market as a whole is therefore Q1 + Q2. The market demand curve is simply the horizontal sum of the individual buyers' demand curves.
As can be seen from the above Figure, an important reason why the market demand curve is negatively sloped (that is, why the quantity demanded in the market increases as the price falls) is the entry of new consumers as the price falls. Individual B chooses not to consume any of the product at prices above P1. As the price falls below that level she enters the market. In general, more and more buyers will enter the market as the price falls, adding their demands to the market demand.
There are also important reasons why the individual consumers' demand curves are negatively sloped. These were mentioned previously but need further elaboration. Individuals consume in order to satisfy certain wants---food, shelter, entertainment, self-image, etc. Different commodities are substitutes for each other in supplying these wants. One can eat chicken, fish or goat instead of beef, or abandon all of these for a vegetarian diet. What one does will depend on the relative prices of these meats. If the price of beef rises substantially, with all other prices remaining the same, many consumers will choose to consume less beef and more fish, goat or chicken.
Broad categories of consumption are also substitutes for each other. For example, a substantial rise in rents relative to the costs of dining out, frequenting bars and going to the cinema may lead some consumers to maintain smaller and cheaper apartments and spend more leisure time on outside entertainment. This tendency to substitute cheaper goods and services for ones whose prices have risen is called the substitution effect. The substitution effect of a price change is always negative---a rise in a good's price reduces the quantity of it demanded.
It should be obvious from the above that the quantity of a good demanded depends not only on its own price but on the prices of substitute goods. For example, consider the demand curve for chicken, plotted in Figure 2.
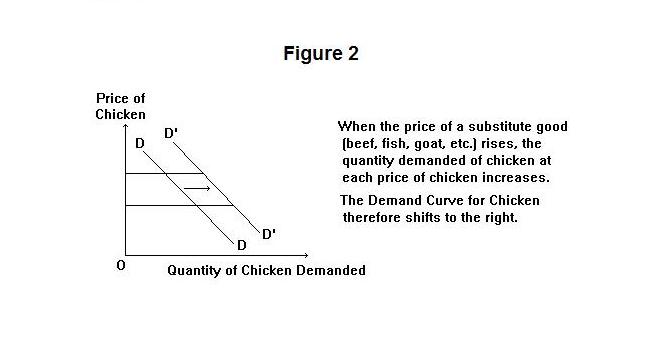
A fall in the price of chicken, holding all other prices constant, will bring about an increase in the quantity of chicken demanded---the price-quantity combination moves downward to the right along the demand curve. At the same time, a rise in the price of beef (or fish, or goat) will also increase the quantity of chicken demanded at every price of chicken. This will shift the demand curve in Figure 2 to the right. A change in the commodity's own price leads to a movement along the demand curve, while changes in the prices of substitute commodities cause the demand curve to shift. In general, the increase in the price of a substitute good shifts the demand curve for a commodity to the right---more of the commodity is demanded at each price.
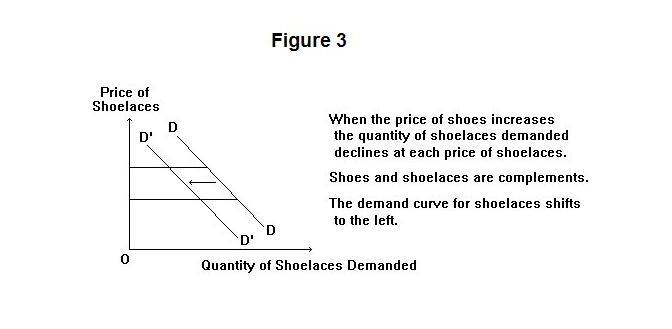
Increases in the prices of other goods do not always cause the quantity demanded of a commodity to increase. Consider, for example, the market for shoelaces. A rise in the price of shoes will cause the quantity demanded of shoes to fall as people repair old shoes and wear them longer. Since there will be a smaller demand for shoes, there will also be a smaller demand for shoelaces. A rise in the price of shoes thus leads to a decline in the demand for shoelaces---the demand curve for shoelaces shifts to the left. People substitute other goods for both shoes and shoelaces. In this case, shoes and shoelaces are said to be complementary goods or complements. The effect of an increase in the price of a complementary good on the quantity of a good demanded is shown in Figure 3.
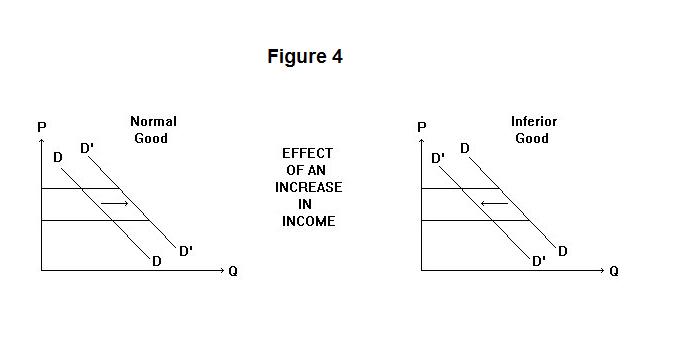
The quantities demanded of commodities are also affected by the level of income. People's entire income must be spent on something (saving is treated here as an expenditure on future goods). When that income rises and more is therefore available to spend it is necessarily the case that consumers' expenditure on goods will, on average, rise. If a good is a normal good, people's expenditure on it will increase as their income increases. The quantity demanded of the good will increase at each price of that good. This is shown in the left panel of Figure 4.
Not all goods are normal. Consider, for example, rice consumption in mainland China. As the country's income rose with the influx of capital from the rest of the world and the development of new enterprises, people were likely to decide that they can now afford to add a bit more meat to their diet and rely less heavily on rice.
One's primary goal is to survive. To survive at low levels of income it may be necessary to spend all available funds on rice, meat being too expensive. At higher incomes, one can purchase much more rice than would be necessary for sustenance. It is then worthwhile to substitute a bit of meat for some of that rice and have a more enjoyable diet. For this reason, the demand curve for rice might well shift to the left with an increase in income. Rice is in this instance an inferior good. This is shown in the right panel of Figure 4 above. When income rises, the demand curves for normal goods shift to the right and the demand curves for inferior goods shift to the left.
Up to this point we have argued that the demand curve is negatively sloped because of the substitution effect---when the price of a good rises consumers substitute other goods whose prices have not risen. But an increase in the price of a good also has an income effect on the quantity of it demanded.
Suppose that you earn $1000 per month and spend $500 of it on rent. Assume that your rent goes up to $600---that is, by 20 percent. The cost of your original consumption bundle is now $1100, so you have to cut your consumption of something---either housing or other goods or both---by $100. Your real income has thus declined by 10 percent. If housing is a normal good, you will allocate some of this cut in overall consumption to it. So there will be a decline in the quantity of housing demanded additional to any substitution of other goods for housing you make on account of the substitution effect. This will make the demand curve for housing flatter than it would otherwise have been, as is shown in the left panel of Figure 5.
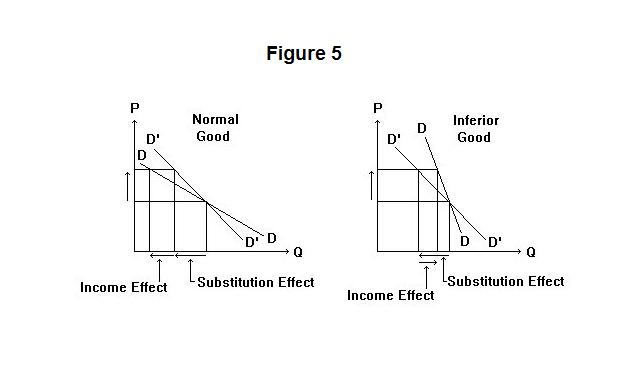
There is, of course, the possibility that the commodity whose price has risen may be an inferior good. In this case the income effect will make the demand curve steeper. The adverse effect on real income of an increase in the price of rice, for example, may make it necessary for people to consume less meat and more rice. This is shown in the right panel of Figure 5.
In the case of normal goods, the income and substitution effects work in the same direction; in the case of inferior goods they work in opposite directions.
It turns out that the income effect is unlikely to be of much importance in practice. People spend tiny fractions of their income on most goods so that the effects on their real incomes of changes in the prices of those goods is likely to be trivial.
It is now time for a test on this topic. Be sure to think up an answer of your own before looking at the one provided.
Question 1
Question 2
Question 3
Choose Another Topic in the Lesson.