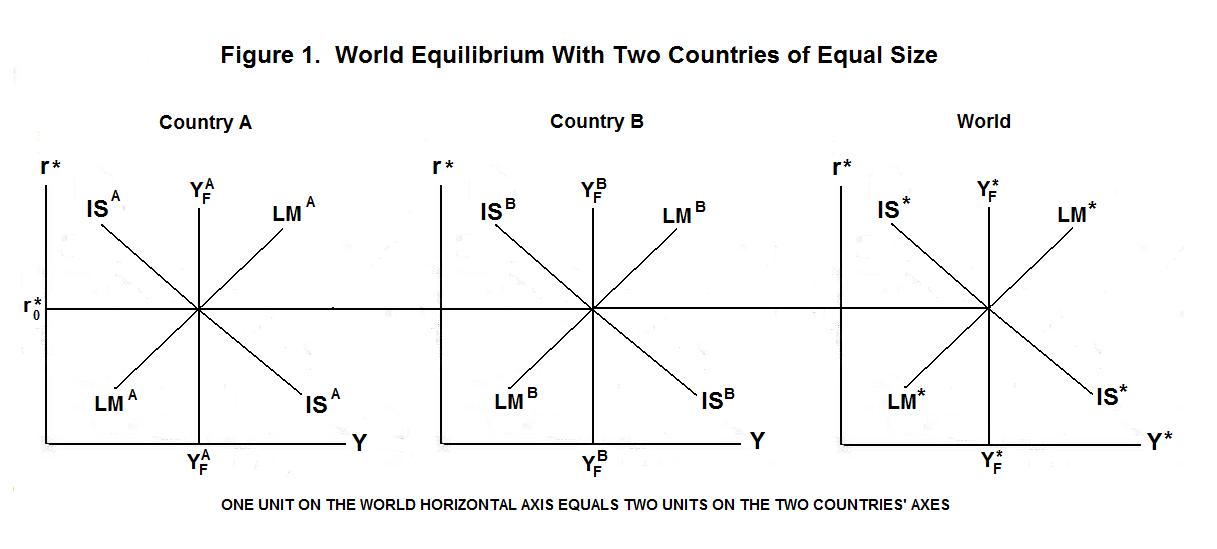
World equilibrium is portrayed in Figure 1. The panel on
the extreme left shows the equilibrium in Country A, the middle
panel gives the equilibrium in Country B, and the right panel
gives world equilibrium. The IS curves in the two countries show
their levels of output and income at the various levels of the
world real interest rate--any feed-back effects between countries
as both expand in response to a decline in the world real interest rate
are incorporated into their respective curves. The world IS curve
is simply the horizontal sum of the IS curves of the two counties with the
scale on the world quantity axes adjusted so that one one unit of output
of the each country equals one-half unit of world output.
Now let us suppose that the world consists of two countries
of similar, say equal, size. We also assume that both countries
use commodities as money---that is, they define their monetary
units as equivalent to given weights of gold or silver, and let
the chosen commodity circulate as money. To make things simple,
we ignore the banking system and assume that the quantity of
money equals the quantity of the precious metal it is defined in
terms of. We also assume that the supplies of gold and silver in
the world are fixed, and therefore unaffected by changes in the prices
of those metals in terms of goods and services---that is, by price
level changes.
The LM curves give the levels of income (= output) at which the countries' residents will willingly hold the existing domestic stocks of money at various levels of the world interest rate. The world LM curve is the horizontal sum to the two countries' LM curves. The full-employment levels of output in the two countries and in the world as a whole are given by the vertical YF lines. Everything is in equilibrium when both countries' IS and LM curves cross at the intersection of the world interest rate line with their full-employment output levels.
Consider two alternative commodity currency regimes---one where country A adopts gold as its commodity currency and country B adopts silver, and one where both countries tie their currencies to gold. When both countries adopt gold we have an international gold standard which implies, of course, that the exchange rate between the two currencies is fixed. When one country adopts gold and the other silver the exchange rate between the two currencies is flexible, being equal to the relative price of gold in terms of silver. We can study the nature of world equilibrium by analyzing the consequences of shocks to that equilibrium.
Suppose that Country A imposes a tariff on its imports. This will shift world demand from B-goods to A-goods, shifting ISA to the right and ISB to the left in Figure 2. In the short run under a world gold standard output in Country A will rise and output in Country B will fall. These output changes will increase the demand for money in Country A and reduce it in Country B. As a result, A-residents will sell assets to B-residents in return for gold. Gold will flow from Country B to Country A. This will shift LMA to the right and LMB to the left until these curves intersect with the new IS curves at the world interest rate.
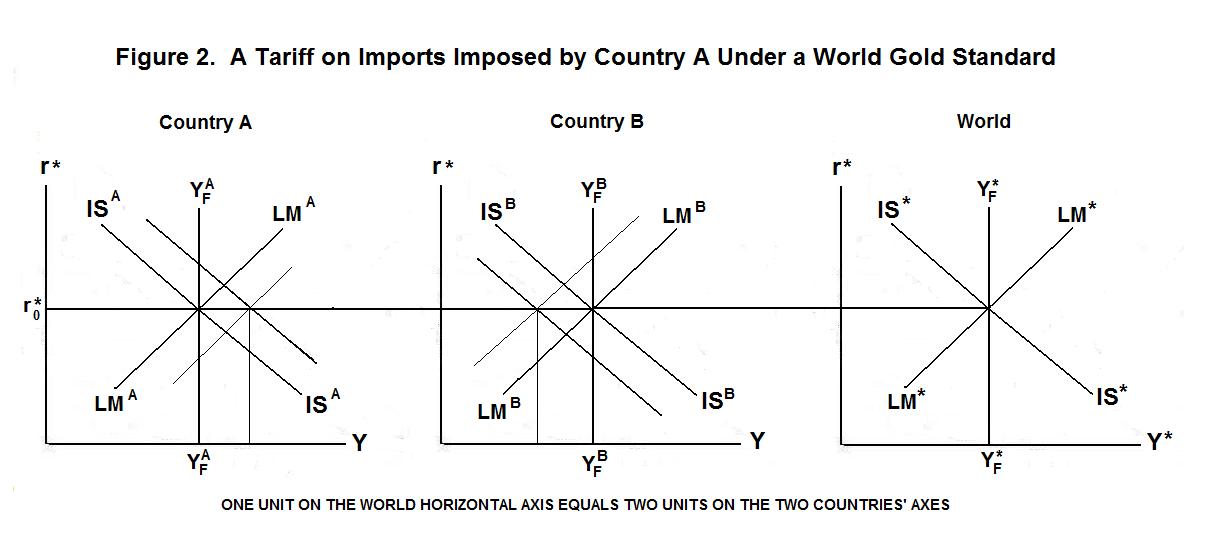
In the long-run, the price level in Country A will rise and the price level in Country B will fall. This will reduce the real stock of money in A and increase the real stock of money in B, shifting the two countries' LM curves back to their original positions. In addition, the increase in the price level in Country A relative to Country B will make Country A's goods more expensive, shifting expenditure from Country A to Country B and returning the two IS curves to their original positions and the countries' outputs back to their full-employment levels. In essence, the real exchange rate adjusts through price level changes to restore world commodity market equilibrium. A-goods become relatively more expensive to compensate for the advantage given them by the tariff.
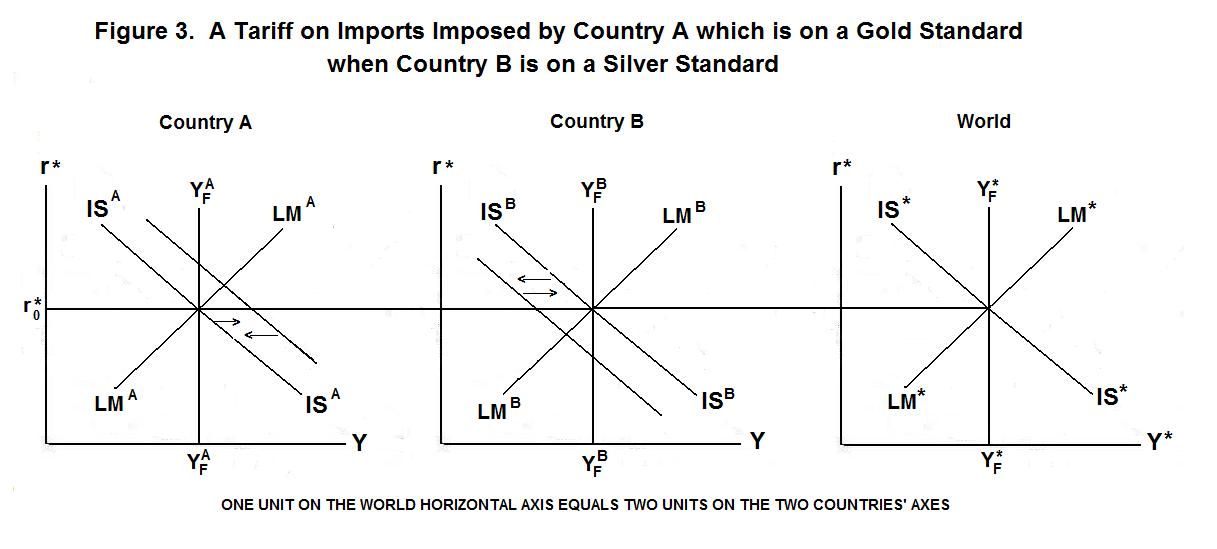
Suppose alternatively that Country A is on a gold standard and Country B is on a silver standard. When the tariff shifts ISA to the right and ISB to the left, increasing income and the demand for money in Country A and reducing income and the demand for money in Country B, the attempts of A-residents to sell assets to B-residents for gold and of B-residents to buy assets from A-residents for silver creates an excess demand for gold and an excess supply of silver. The price of gold rises and the price of silver falls. This raises the price of A-goods relative to B-goods and shifts the two countries' IS curves back to their original positions, as shown in Figure 3. Country A's currency has appreciated in the world market to re-establish equilibrium. No change in outputs, employments, or price levels occur.
Now let us return to the case where both countries are on a gold standard and assume that, starting from a position of equilibrium, the government of Country A is required to give a reparation to the government of Country B equal to one-quarter of the national gold stock. The A-government taxes gold from A-residents and transfers it to the B-government, which distributes the gold to B-residents. This will shift LMA to the left and LMB to the right in Figure 4. A-residents will now hold too small a stock of money at their current income level and B-residents will have excess money balances. To maintain portfolio equilibrium, the residents of Country A will sell assets to the residents of Country B for gold. Gold will move back from Country B to Country A, shifting the LM curves back towards their original positions.
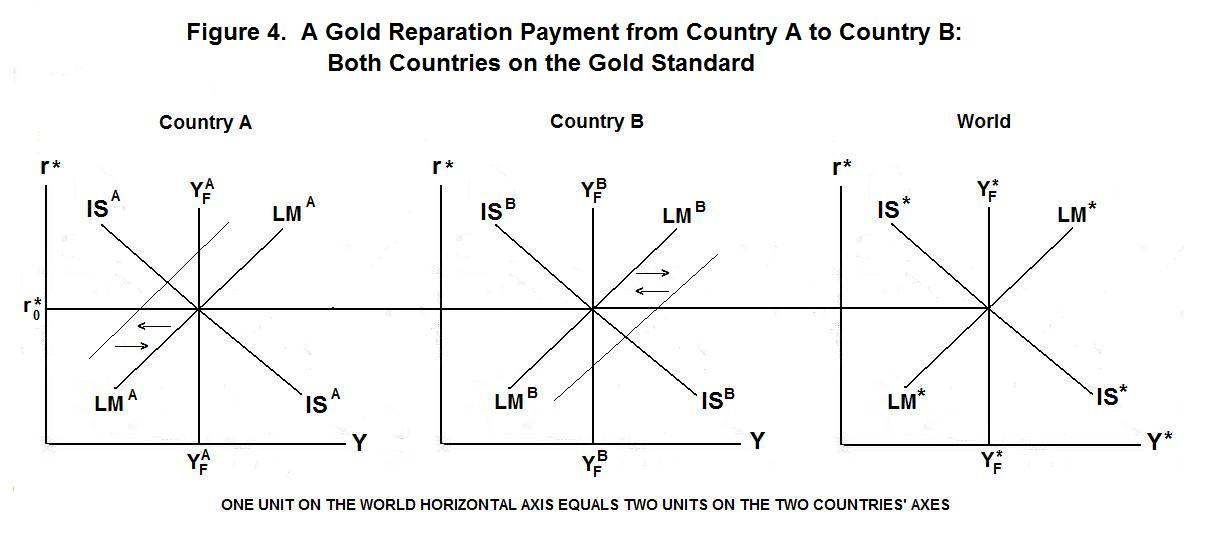
This leaves the residents of Country B with ownership of some of the capital that Country A's residents previously owned. A-residents will now have smaller interest earnings and residents of B larger interest earnings so there will have been a shift of income from country A to country B. And A-residents, having less income will end up buying less B-goods with B-residents, having more income, buying more A-goods. The relative price levels of the two countries, and hence the real exchange rate, may have to change as equilibrium is reestablished. The direction of this effect will depend on whether the shift of interest earnings resulting from the movement of capital---that is, the decline in Country A's debt service balance---exceeds or falls short of the shift in the balance of trade in goods---that is, the increase in Country A's trade balance.
Now suppose that the two countries are on a gold standard and there is a substantial gold discovery in Country A. This will shift LMA to the right to LMA' in Figure 5. Since the world gold stock has increased, LM* will also shift to the right, but only by half as much as the rightward shift of LMA. Recall that the two countries are the same size, with Country A therefore making up half the world. The rightward shift of LM* drives the world interest rate down and output rises in both countries. A-residents will have excess money holdings, and B-residents deficient money holdings at the new levels of output and the world interest rate, so gold will flow from Country A to Country B in return for non-monetary assets, shifting the LMA to the left and LMB to the right until they pass through the intersections of the IS curves and the new world interest rate line.
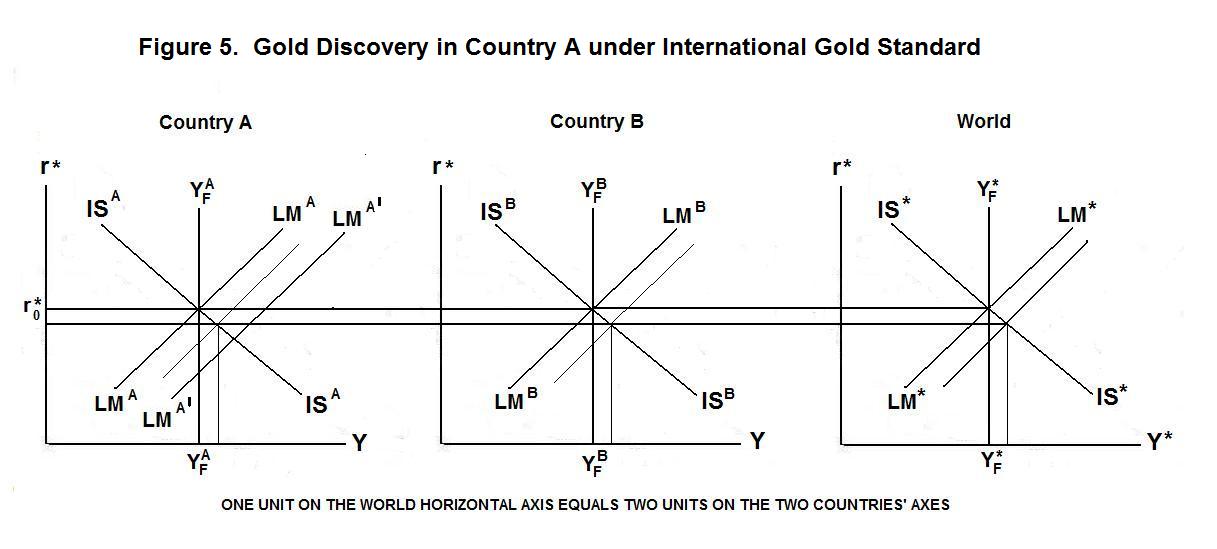
In the long run, prices in both countries will rise, shifting their LM curves and the world LM curve back to their levels before the gold discovery occurred. The world interest rate returns to its original level and full employment is re-established in both countries.
Suppose now that the same gold discovery occurs in Country A, but that Country B is now on a silver standard. Again, LMA and LM* both shift to the right with LM* shifting by half as much as LMA. And the world interest rate again falls. Excess supply of money again occurs in Country A and excess demand for money in Country B. Now, however, the attempt of A-Residents to sell gold for assets and of B-residents to sell assets for silver causes the price of gold to fall relative to the price of silver. This constitutes a devaluation of A-currency, which shifts ISA to the right and ISB to the left until they pass through the intersections of the respective LM curves and the world interest rate line. This is shown in Figure 6.
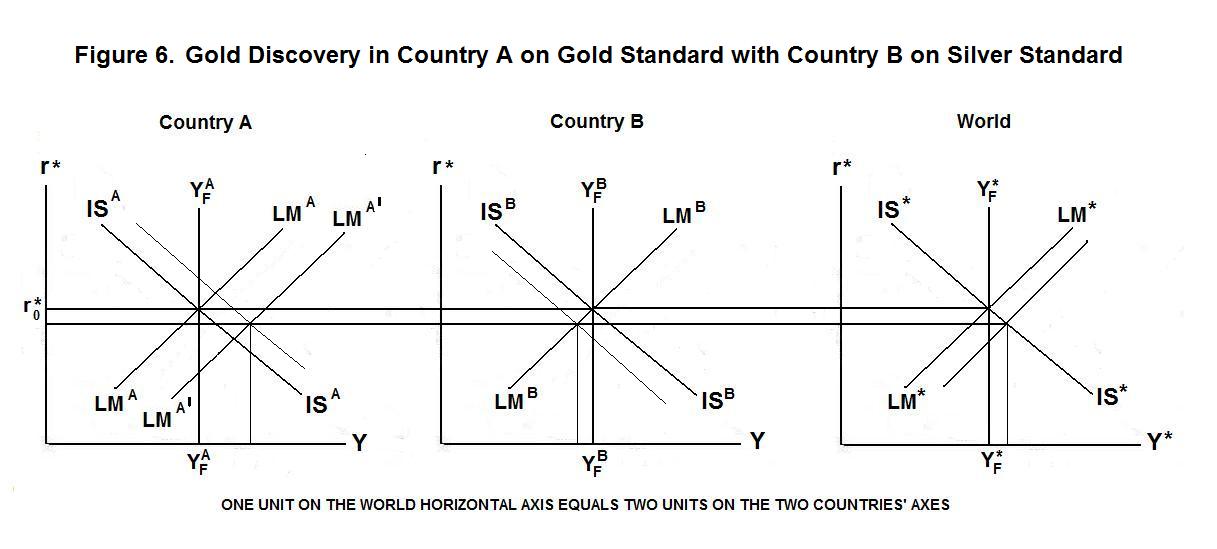
Notice that income and employment rises in Country A as a result of both the fall in the world real interest rate and the shift of demand from B-goods to A-goods consequent on the devaluation of A-currency. Output in B falls because the effect of the rise in the price of gold relative to silver on the country's trade balance more than offsets the effect of the fall in the world real interest rate on domestic investment.
In the long-run, wages and prices in A rise until LMA returns to its original position and full-employment is regained. As this happens, LM* returns to its original position and the world interest rate goes back to r*0. Since nothing has affected the full-employment levels of output or the full-employment levels of savings and investment in the two countries, the real exchange rate must return to its original position. This means that the real quantity of money demanded in A will return to its original level, with the result that the price of gold will have to rise in Country A until the real value of gold---that is, the real stock of money---is the same as it was before the discovery.
Since nothing has happened to change desired savings or investment or full-employment output in Country B the demand for real money holdings in that country will remain unchanged. This means that the price level in Country B and, as a result the price of silver, will be unchanged in the long-run by the gold discovery. The nominal quantity of money and the price level in Country A have increased in the same proportion with that country's currency---that is, gold---devaluing in that proportion. This leaves the real exchange rate unchanged. It's time for a test. Again, think up your own answers before looking at the ones provided.
Question 1
Question 2
Question 3
Choose Another Topic in the Lesson.