Prices measure the amount of money that has to be given up to
obtain units of the goods in question. Correspondingly, the price
level measures the amount of money that has to be given up to buy
a unit of the average good in the economy---or, roughly, a unit of
aggregate output. The amount of output one must give up to obtain
a unit of money is therefore equal to the reciprocal of the price
level. The inverse of the price level thus represents what a unit
of money is worth in terms of goods, or the value of money.
So the question of what determines the price level boils down to
the question of what determines its reciprocal or the value of money.
It is natural to think of the value of money as determined
in the same way as the value of any other good or service---by the
supply and demand for it. Analysis of the supply and demand for
money differs slightly from that of the supply and demand for typical
goods produced in the economy because money holdings are a stock
while goods produced are flows. This difference is not substantive
however---we simply measure the stock of money held by the public on
the horizontal axis of our supply and demand graph instead of the
quantity of a good purchased per unit time. The determination of the
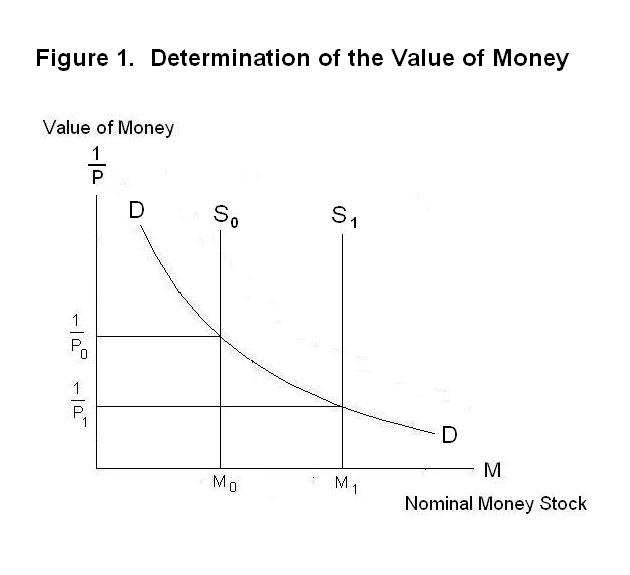
price level can thus be analyzed with respect to Figure 1. The nominal
money stock is on the horizontal axis and the value of money---which
equals 1/P where P is the price level---is on
the vertical one.
The consequences of unfettered printing of paper money
were deemed undesirable in several places in the previous Topic.
Now we turn to an analysis of the effects of excess money growth.
The discussion focuses on the determinants of the price level.
It will be recalled that the price level is the average of
all prices in the economy, taken as a percentage of that same
average in some earlier base period. And inflation is the growth
or increase, on average, of prices---the annual rate of inflation
is the year-to-year percentage growth of the price level.
Ideally, we conceive of the stock of money as the amount of liquidity in the economy. You will recall that liquidity is an attribute possessed by assets that represents the ease with which they can be converted into a predictable amount of cash for making exchange. Most assets possess some degree of liquidity but only cash is completely liquid. Because assets possess varying degrees of liquidity, we can only imperfectly measure the quantity of liquidity in the economy. The two most common measures of the quantity of liquidity---that is, the money supply---are M1, which equals cash plus demand deposits, and M2, which equals cash plus both demand and time deposits. For the remainder of this Lesson we will simply think in terms of a conceptual stock of money that we will call M which can be approximately measured by either M1 or M2.
The supply curve in Figure 1 is thus a vertical line positioned to the right of the vertical axis by an amount equal to the existing stock of nominal money balances in circulation. When the central bank increases the money supply this vertical line shifts rightward. The demand for nominal money stock, given by the curve DD, is downward sloping to the right like any demand curve. It is not, however, a straight line. The reason is that people make their decisions on how much money to hold on the basis of the real, not the nominal, quantity.
Suppose that the private sector holds a given nominal quantity of money M0. The amount of transactions that can be made with that quantity of nominal money balances will depend on the price level---if the price level were to double, the existing nominal level of money holdings would finance only half of the previous volume of transactions. People would require twice as big a nominal money stock to provide the same level of transactions services. In other words, the amount of transactions services provided by money will depend on the real stock of money, not the nominal stock.
People will thus decide on an appropriate level of real money holdings and then accumulate the stock of nominal money balances needed to provide those real holdings. Thus, given desired real money holdings, the nominal quantity of money demanded will vary in direct proportion with the price level and in inverse proportion with the nominal value of money.
Since the public decides on a desired real money stock, M/P, the rectangular area under DD associated with each given level of M will be a constant equal to 1/P times M, which will equal M/P. The demand curve for nominal money balances DD will thus be a rectangular hyperbola. A given rise in M will cause P to rise, and 1/P to fall, in the same proportion as that rise in M as we move along the curve.
If the central bank creates the quantity of money M0, the equilibrium price level will be P0. If it increases the quantity of money to M1, the price level will rise to P1 and the value of money will fall to 1/P1.
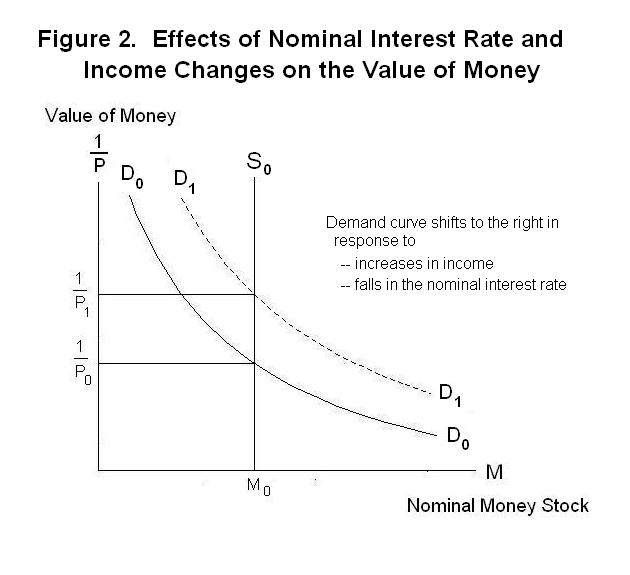
Having established the shape of the demand curve for nominal money holdings, we must now think about what will determine its level---that is, the level of desired real money holdings. One obvious factor will be the real flow of transactions, which can be roughly measured by the level of real income. A rise in real income, and the associated increase in the transactions demand for money, will thus shift DD to the right as shown in Figure 2. A second factor will be the cost of holding money relative to other assets.
People hold money because it saves time and labour effort that would otherwise have to be devoted to arranging barter and checking other people's credit ratings. That effort could have been devoted to producing goods and services for consumption and investment. But the choice of how much money to hold, and how much labour to thereby make available for other uses, will depend on how much income will be sacrificed by holding additional money instead of other assets. Assuming that money holdings earn no interest, that sacrifice will be the interest that could have been earned by holding bonds and other assets instead of that additional money. Bonds and other assets that are fixed in nominal value will earn interest at, say, i percent. Real assets such as cars and TV sets will earn a return equal to, say, r percent. As we saw in the previous Lesson, Interest Rates and Asset Values, the difference between the interest rates on nominal assets such as bonds and the return on real assets such as cars and TV sets will be the expected rate of inflation. This is given by the Fisher equation
1. i = r + τ
where i is the nominal or market interest rate τ is the expected rate of inflation and r is the real interest rate. Since the real value of bonds will deteriorate at the expected rate τ, the real interest rate expected to be earned on them will equal r, the implicit interest rate earned on real assets. The interest rates implicitly earned on real assets do not contain premia for expected inflation because the market value of those assets will rise with inflation along with the earnings on them. Of course, interest is not directly earned on real assets---earnings on those assets are the streams of implicit or explicit rental income from their use. The implicit interest rate on those assets is the ratio of those earnings to their present value.
When the nominal interest rate earned from holding money is zero, the real interest rate expected will be -τ, the deterioration in the value of money expected to result from inflation. The sacrifice from holding money instead of cars or TV sets will thus be equal to the real interest that could have been earned by holding those real assets, r, plus the expected annual deterioration in the real value of money holdings, τ. This will sum to i . And the sacrifice from holding money instead of bonds will equal the real interest expected on bonds, r, plus the expected annual deterioration in the real value of money holdings---these also sum to i, the nominal return from holding bonds. The opportunity cost of holding money instead of other assets is thus equal to the nominal interest rate.
The higher the nominal interest rate, the smaller will be the desired level of real money holdings. A decline in the nominal interest rate will thus shift DD to the right in Figure 2. The demand for real money holdings will also be affected by changes in transactions technology. For example, the introduction of automatic teller machines (and before them, credit cards) will have made money holdings more accessible, reducing the amount of real money balances needed to effect a given volume of transactions. People would be expected to have reduced their real money holdings as a result, shifting the DD curve to the left. Speculative shocks to desired real money holdings can also occur in response to expected future changes in nominal interest rate and the resultant capital gains or losses from holding bonds instead of money.
The cause of inflation can now be easily seen from Figures 1 and 2. A rise in the price level, or fall in the value of money, can result only from an increase in the supply of money or decline in the demand for money. While the general growth of income will increase the demand for money and improvements in the technology of making transactions will reduce it, these effects will be gradual over time. They can thus account for changes in inflation rates of only a few percentage points. And the government can offset these effects by appropriate adjustments of the money supply. The cause of major inflations, of 10 percent per year or more, will inevitably be excess expansion of the money supply on account of the policies of the government---in particular, the monetary finance of government expenditures.
We conclude this Topic by introducing the concept of velocity of circulation. The income velocity of money is defined as the ratio of nominal income to nominal money holdings or, equivalently, the ratio of real income to real money holdings:
2. V = P Y / M = Y / (M/P)
where V is income velocity and Y is real income. An income velocity (ratio of income to money) of 4, for example, means that each dollar has to be spent (or circulate) 4 times to transact the level of income. A higher demand for money balances (or desired ratio of money to income) implies a lower income velocity. When we multiply both sides of Equation 2 by M we obtain
3. M V = P Y
which is called the equation of exchange. The equation of exchange states that the nominal money stock times the income-velocity at which it circulates equals the flow of nominal income. Using some elementary calculus we can take the relative changes of both sides of Equation 3 to obtain
4. ΔM / M + ΔV / V = Δ P / P + ΔY /Y
which can be rearranged to bring ΔP / P to the left side to obtain
5. ΔP / P = ΔM / M + Δ V / V − ΔY / Y
To maintain the inflation rate, ΔP / P, equal to zero the central bank must increase the money supply at the rate
6. ΔM / M = ΔY / Y − Δ V / V
If real income is growing at 3 percent per year and income velocity is, say, falling at 1 percent per year, the central bank can maintain a zero rate of inflation by increasing the nominal money supply at 3 percent plus 1 percent, or 4 percent per year. Positive inflation thus results when the government increases the money supply at a rate in excess of the growth rate of income minus the rate of growth of income velocity or plus the rate of growth of the demand for money.
It is now time for a test on this Topic. As always, think up your own answers before looking at the ones provided.
Question 1
Question 2
Question 3
Choose Another Topic in the Lesson