To examine the effects of various institutional arrangements on economic
welfare we can further develop the supply and demand tools introduced
in the previous Lesson entitled Supply and Demand.
We first examine the relationship between the demand curve and
the benefits from consuming the product in question, starting
with the individual consumer's demand curve and then moving
to consider the market demand.
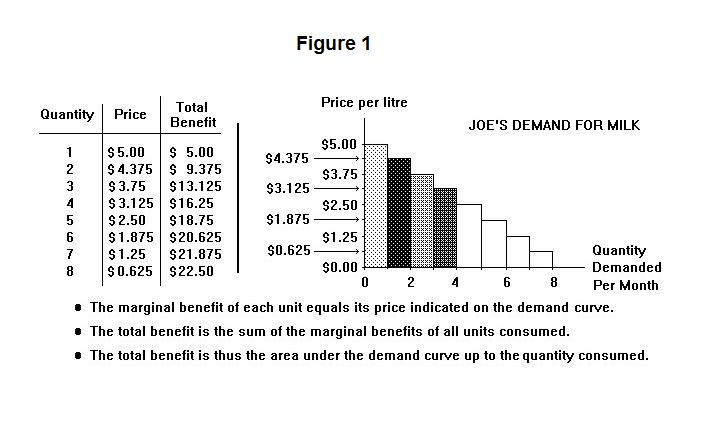
Consider the demand curve for milk of an individual consumer, call him Joe.
This is shown in Figure 1. Suppose that we start Joe out at a price of $5.00.
He will purchase one litre of milk per month. Since Joe could consume $5.00
worth of other goods with the money he spends on the litre of milk, it is
evident that he is willing to give up $5.00 worth of other goods to have it.
We can therefore say that the benefit he gets from consuming the litre of milk
is $5.00---if we were to give him the litre of milk for free it would be like
adding $5.00 to his income.
Now suppose we lower the price to $4.375 (two for $8.75). Joe was already consuming one litre of milk per month. Now he will consume 2 litres per month. Since he is willing to give up $4.375 of other goods to get this second litre, we can say that the benefit to him of consuming this litre is $4.375. He got $5.00 benefit from consuming the first litre of milk and now he gets an additional $4.375 from consuming the second litre. His total benefit from milk consumption is now $9.375 per month. He would be willing to give up $9.375 of other goods to obtain these two litres of milk. Since the price he actually pays for the two litres is $8.75, he gains $0.625 more than his cost--he earns a surplus of $0.625.
Joe earns a surplus because he would be willing to give up $9.375 of other goods to obtain 2 litres of milk per month but only has to give up $8.75. The $8.75 is what economists call his alternative opportunity cost---the alternative consumption opportunities he gives up in order to consume the two litres of milk per month. His total benefit exceeds his alternative opportunity cost because he would be willing to pay $0.625 more for the first litre of milk than he actually has to pay at the price of $4.375.
In fact, the government could tax Joe $0.625 for the priviledge of buying two litres of milk and consuming them and he would still do it---he would have no longer receive a net benefit, but his total benefit would cover his opportunity cost. Economists call these net benefits that could be taxed away without affecting the individual's behavior economic rent (not to be confused with the rent on your apartment).
If we now lower the price to $3.75, Joe will add a third litre to his monthly consumption of milk. His benefit from consuming this additional litre will be $3.75 and his total benefit from consuming all three litres will be $5.00 + $4.375 + $3.75 = $13.125. Since he pays 3 x $3.75 = $11.25, his surplus is now $2.125---he would be willing to pay $0.625 more for the second litre than he actually has to and $1.25 more for the first one. When we lower the price to $3.125, Joe consumes a fourth litre and obtains a gross benefit of $16.25, which is equal to the sum of the shaded areas under the demand curve. His surplus will now be $3.75.
Suppose that we let Joe consume all the milk he wants fee of charge. He will consume 8 litres per week. His gross benefit (and net benefit as well, because he pays a zero price) will be the entire area under the demand curve.
Let us give Joe an "all or nothing" opportunity. For a fixed price we will let him consume all the milk he wants---otherwise he can consume nothing. We can see from Figure 1 that Joe would be willing to pay $22.50 for this free access to milk. Notice that each individual shaded area under the demand curve in the Figure represents the marginal gross benefit to Joe from consuming a successive additional litre of milk. The total gross benefit equals the whole area under the demand curve up to and including the last unit consumed. The marginal benefit is thus the change in the total benefit when an additional unit is consumed. The total gross benefit is therefore the sum of the marginal benefits from consuming successive units. To calculate the net benefit, of course, we have to subtract out the amount Joe actually pays for the amount he consumes.
Suppose that Joe ends up paying $1.25 per litre for milk. Notice that the marginal cost of milk to Joe will be $1.25---an increase in his consumption by 1 litre adds $1.25 to his total cost of milk, regardless of the actual level of his milk consumption. The marginal benefit of milk consumption to Joe is given by the vertical distance between his demand curve and the horizontal axis. So guess what Joe does? He consumes up to the point where his marginal benefit from another unit of consumption equals his marginal cost. This way, he maximizes his net benefit. The quantity consumed will be 7 litres per month.
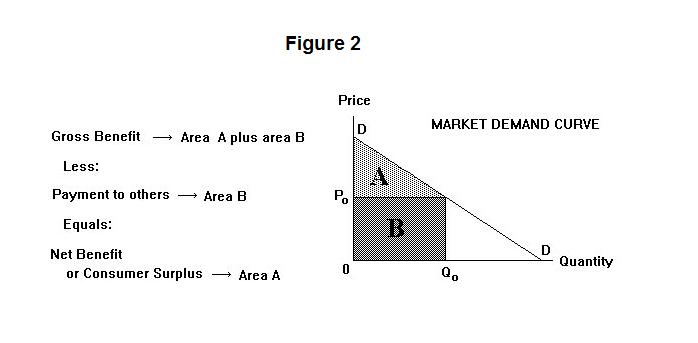
Now let us horizontally add together the demand curves of all the individual consumers of the product to obtain the market demand curve. An example is given in Figure 2. The distance between the market demand curve and the horizontal axis multiplied by one unit of quantity gives the marginal benefit from consuming that unit to whoever consumed it. So, as in the case of the individual demand curve, the area under the market demand curve up to the quantity consumed represents the total benefit from consuming that quantity---the total benefit in this case is the sum of the total benefits to all consumers in the market.
When we add together the benefits of all consumers, however, we run into a tricky situation. Suppose we observe a particular demand curve and find that the area under it is equal to, say, $100.00. Now let us redistribute income in the community, taking income away from the people that like to consume this commodity and giving the income to those who prefer to spend most of their income on other commodities. Less of this particular good will be consumed now in total, and the market demand will shift to the left. The total benefit from consuming the good, measured by the area under the demand curve will now be smaller.
Thus, the size of the area under the market demand curve for any particular product will depend on how income is distributed in the economy. This means that we have to be a bit careful about making quantitative judgements about the benefits to society from consumption of particular commodities on the basis of the areas under the demand curves for those commodities. But qualitative judgments about the direction of the effects of changes in the quantity consumed on the economy's total benefit and consumer surplus will still give an accurate general picture of what is happening.
As shown in Figure 2, the quantity consumed will always be that quantity at which the marginal benefit to the consumer, measured by the distance between the demand curve and the horizontal axis, equals the marginal cost to the consumer, given by the price paid. At price P0, therefore, the marginal benefit and the marginal cost of consuming an additional unit at the quantity Q0 will be equal. The gross or total benefit will be the sum of the two areas A and B. The area B represents the amount consumers pay for the quantity Q0, leaving the area A as the consumer surplus or consumer rent.
Before proceeding to a test we must make one further point. The area under the demand curve represents the total benefit to members of society from their own consumption of the good---it is the benefit of to the individual consumer that is measured by the area under his/her demand curve. Suppose that the commodity being consumed is heroin. Many people in the community will not only choose not to consume heroin themselves, but will feel worse off because somebody else is consuming it. They may be willing to pay a sum of money to prevent others from consuming the commodity. This non-monetary cost to people of knowing that others are consuming an offensive (to them) commodity is called a consumption externality. It is a (negative) benefit external to the individual actually doing the consumption---that is, the benefit is received by some other person or persons. Such Consumption externalities may, of course, be positive as well as negative---for example, an individual's attendance at church may provide benefits to others (for example, his parents) that are independent of any benefits he himself receives.
It is now time for a test. Think about your answers carefully before looking at the ones provided.
Question 1
Question 2
Question 3
Choose Another Topic in the Lesson.