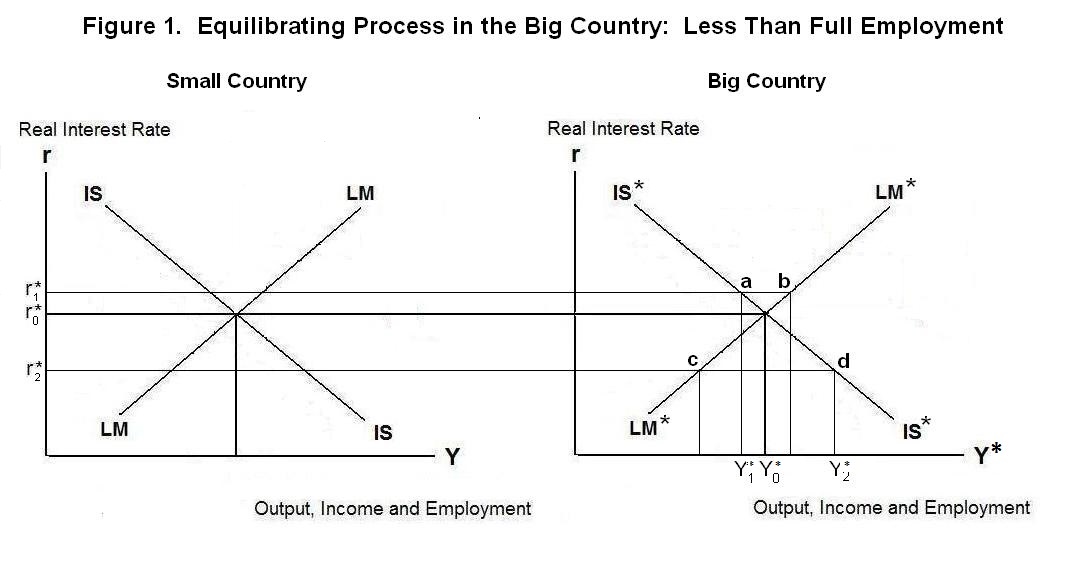
The analysis can begin with reference to Figure 1. The
small country's equilibrium is shown in the left panel and
equilibrium of the big country in the right panel. The scales
on the horizontal axes are set so that an equal percentage
change in the two countries' outputs will represent the same
distance along the two axes. The scales on the vertical axes
are the same in both panels. We start by assuming that the two
countries' price levels are fixed and both are operating at
less than full employment. A star * superscript is used to
denote big-country variables and curves.
Up to this point the discussion has centered on the situation of
a small open economy operating in an environment where
the real interest rate is determined in the rest of the world.
We now consider the case where the country being analyzed is big
enough to have an influence on the world real interest rate,
beginning with an extreme case where the rest of the world is one
big country. The world thus consists of two countries---a very
big one and a tiny one. The first step is to analyze the condition
of simultaneous equilibrium in the big and small economies.
As should now be understood, the IS curves give the combinations of incomes and the real interest rate for which the quantities of the countries' outputs demanded equal the amounts produced. As the real interest rate falls investment increases, increasing the equilibrium levels of output. Tax cuts and government expenditure increases, under the traditional Keynesian assumptions, shift the IS curves to the right. A devaluation of the small country's currency will shift world expenditure onto its goods, causing its IS curve to shift to the right and the IS curve of the big country to shift to the left. The small country is so small in relation to the big country, however, that a significant rightward shift in its IS curve consequent upon a devaluation leads to too small a leftward shift in the big country's IS curve to be noticeable on the graph.
The LM curves give the combinations of income and the world real interest rate for which asset markets are in equilibrium. As shown previously, this occurs where the countries' demands for money equal the respective quantities in circulation. An increase in the world interest rate reduces the quantities of money demanded by both countries' residents. For the existing quantities of money in the two countries to be willingly held, their levels of income must increase. This is why the LM curves are positively sloped. An decrease in the real quantity of money demanded in a country or an increase in the real money supply resulting from either an increase in the nominal money supply or a fall in the price level will cause that country's LM curve to shift to the right.
Ignore for now the small country and concentrate entirely on the process by which equilibrium is achieved in the big country. Suppose, for example, that the real interest rate is at r1* in Figure 1. At this real interest rate, the big country's income will equal Y1* . But at those levels of income and the real interest rate there will be an excess supply of money---income would have to be higher than Y1* by the amount a b to get the big country's residents to hold the existing quantity of money. People will thus try to unload their excess money holdings and buy assets. This will increase the world demand for assets, causing asset prices to rise and the world real interest rate to fall.
The fall in the world interest rate will lead to an increase in the level of output produced (and an increase in income) as we move downward to the right along the big country's IS curve. And as income rises and the real interest rate falls, the excess supply of money will decline---the distance comparable to a b decreases as r* falls. Equilibrium will occur at interest rate r0* and income level Y0* where the excess supply of money has been eliminated.
Similarly, if the world real interest rate is at r2* the equilibrium level of income in the big country will be Y2* and there will be an excess demand for money on the part of big-country residents equal to c d . They will try to sell assets to acquire the necessary increase in money holdings, bidding asset prices down and the real interest rate up until it reaches r0* . Income will again become Y0* . Equilibrium occurs where IS* crosses LM* .
Now assume that the equilibrium world interest rate has been established by the conditions of equilibrium in the large country and consider the situation of the small country at that world real interest rate in the left panel of Figure 2. The process by which equilibrium is achieved will depend upon whether the small country adopts a fixed or flexible exchange rate. The big country doesn't care about the exchange rate since its level has no bearing on big-country equilibrium. We start by assuming that the exchange rate is fixed.
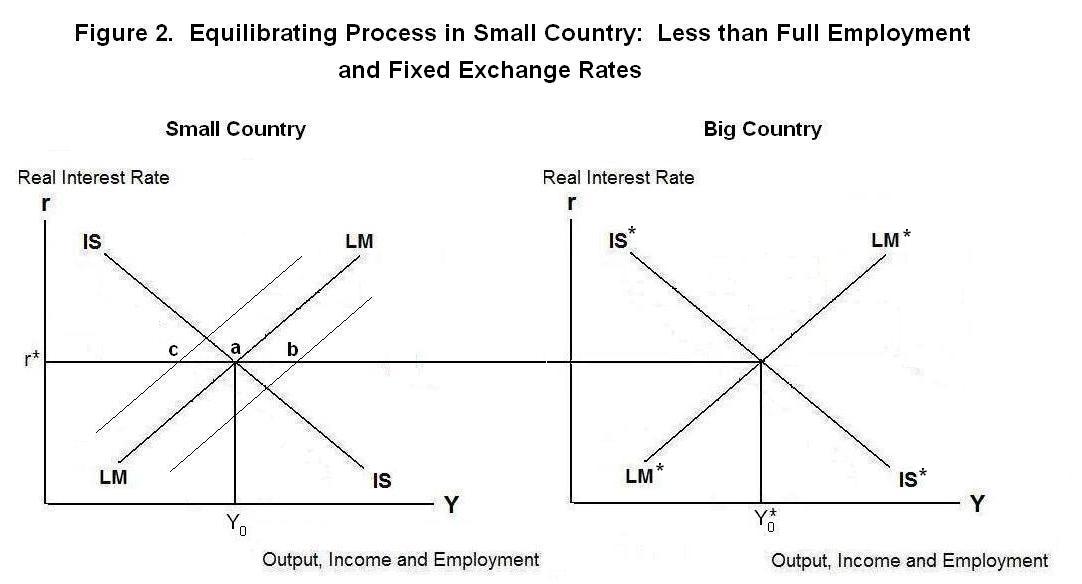
You should already have learned that under a fixed exchange rate small-open-economy equilibrium is determined by the IS curve in conjunction with the world real interest rate. The small country's central bank is forced to adjust the money supply until the LM curve crosses the IS curve at the world interest rate---for example, at point a . If the money supply is in excess of the quantity demanded the LM curve will cross the world interest rate line at some point such as point b . People will unload their excess money holdings by purchasing assets from residents of the large country. To keep the currency from depreciating, the small country's authorities must satisfy the resulting excess demand for foreign exchange by selling some of their official reserves for domestic currency. This will drive the LM curve to the left until it passes through point a . Similarly, when there is an excess demand for domestic currency at output level Y0 the LM curve will cross through some point such as c . Domestic residents will sell assets abroad to acquire money balances and the small country's central bank will be forced to sell domestic currency in return for foreign currency to keep it from appreciating. This infusion of money will shift the LM curve to the right until it passes through point a .
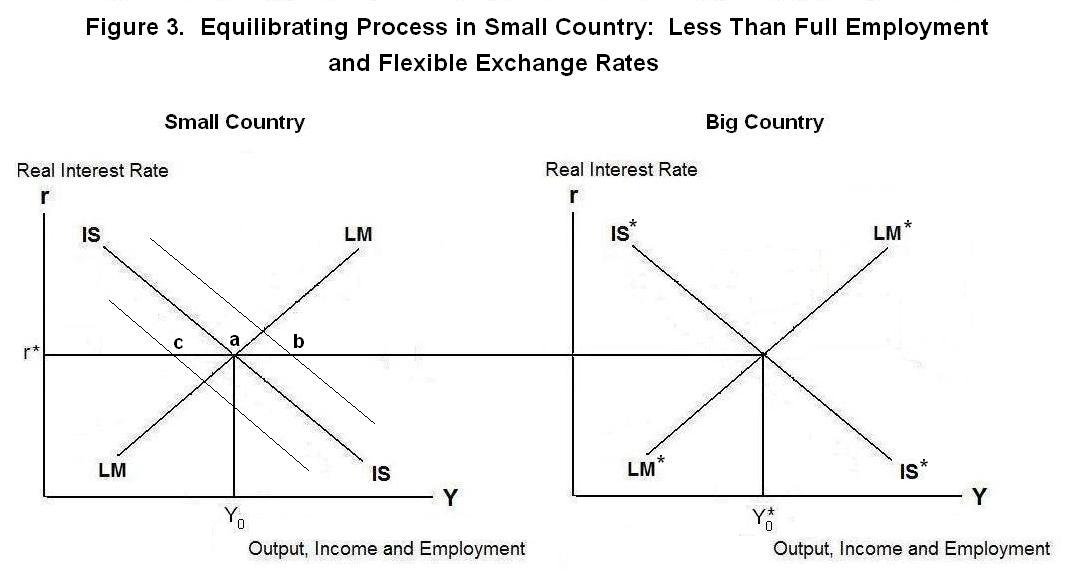
When the exchange rate is flexible, small-country equilibrium is determined by the LM curve in combination with the world interest rate as shown in Figure 3. The IS curve will then adjust endogenously through changes in the exchange rate until it passes through the intersection of the LM curve with the world interest rate line, as shown at point a . If the value of the domestic currency in terms of the foreign currency is too low, the IS curve will be too far to the right, as indicated by point b . The tendency of the excess demand pressure to increase domestic income above Y0 will increase the demand for money, causing the small country's residents to try to sell assets abroad. This will cause the currency to appreciate, driving the IS curve to the left to intersect LM at point a . When the value of the domestic currency is too low, the IS curve will be too far to the left---say, at point c . The downward pressure on domestic output and income will reduce the demand for money and cause the small country's residents to reestablish portfolio equilibrium by purchasing assets abroad. This will create an excess supply of the domestic currency on the international market, causing it to depreciate. The resulting switch of world demand onto domestic goods will shift the IS curve to the right until it crosses LM at point a .
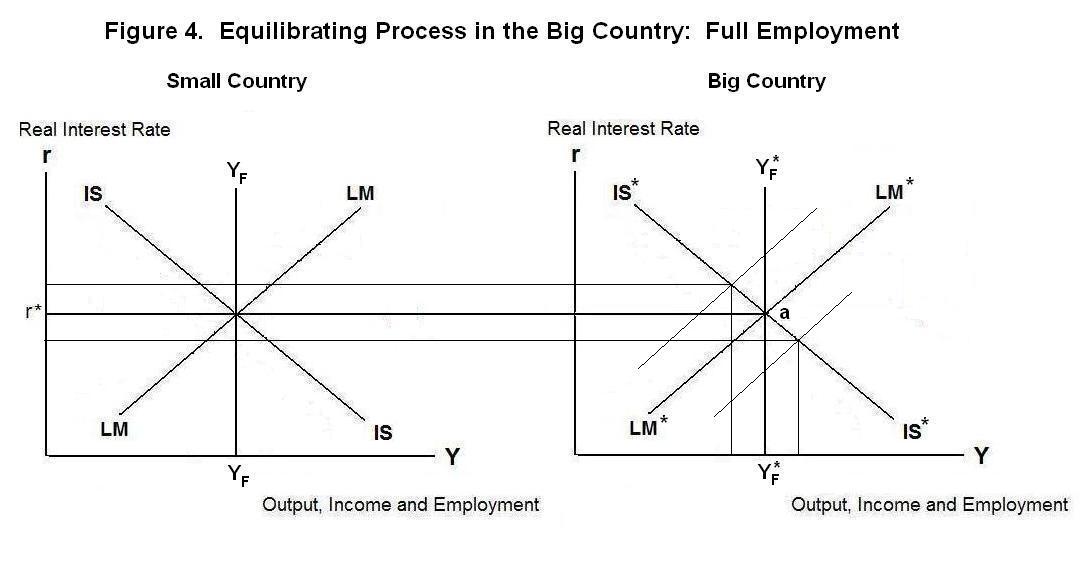
Now we relax the assumption of fixed prices and less-than-full employment. The full employment output levels are given by the vertical lines YF* YF* and YF YF in Figure 4. In both countries the real money stock must adjust to drive the LM curve through the intersection of the IS curve and the vertical full-employment-output line. In the big country, an LM curve to the right of LM* will result in a level of output above full-employment. Wages and prices will rise, reducing the real quantity of money and shifting LM to the left until it passes through point a in Figure 4. If LM is to the left of LM* , output will be below full-employment and wages and prices will fall, increasing the real quantity of money and driving LM to the right to again pass through point a .
The situation in the small country under full-employment conditions is analyzed in Figure 5. Both the IS and LM curves must pass through point a . If IS passes to the left of this point, the small country's real exchange rate must decline to switch sufficient world demand onto domestic goods to eliminate the shortfall of aggregate demand. If the exchange rate is fixed the decline in the real exchange rate will be brought about through a fall in the price level. If the exchange rate is flexible, the nominal exchange rate will decline. The IS curve will shift to the right until it passes through point a . Similarly, if IS lies to the right of point a , the real exchange rate will appreciate either through an increase in the price level or through an appreciation of the nominal exchange rate, shifting IS to the left until it passes through point a .
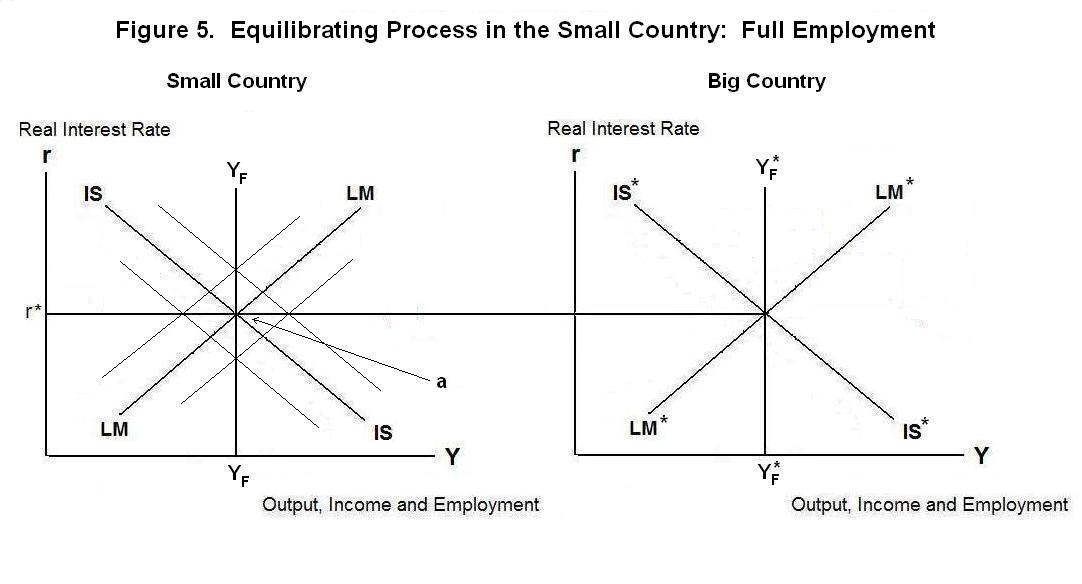
If the LM curve passes to the right of point a the small country's residents will be holding excess money balances. If the exchange rate is flexible, the price level will rise to shift the curve back through point a . In the process, the nominal exchange rate will adjust to ensure that IS continues to pass through point a . If the exchange rate is fixed, domestic residents will reestablish portfolio equilibrium by purchasing assets abroad, forcing the authorities to sell foreign exchange reserves in return for domestic currency to keep the currency from depreciating. As a result LM will shift to the left until it passes through point a . If the LM curve happens to pass to the left of point a , the price level will fall under flexible exchange rates until it passes through point a , with the nominal exchange rate adjusting to ensure that IS continues to pass through point a . Under a fixed exchange rate, the authorities will be forced to accumulate foreign exchange reserves, and thereby increase the domestic money supply, until LM has shifted to the right sufficiently to pass through point a .
It's time for a test. Think up your own answers before looking at the ones provided.
Question 1
Question 2
Question 3
Choose Another Topic in the Lesson.