Two important considerations arise in all applications
of supply and demand analysis. First, the shapes of the supply
and demand curves must be established within the context of the
problem being analyzed. Second, the forces leading to shifts in
the supply and demand curves must be determined in the case at
hand. The effects of the forces shifting the supply and demand
on the equilibrium price and quantity can then be obtained.
It is useful to begin with a some simple applications that
follow directly from supply and demand relationships that have
been developed earlier in this lesson. Then we can proceed to
more complex situations.
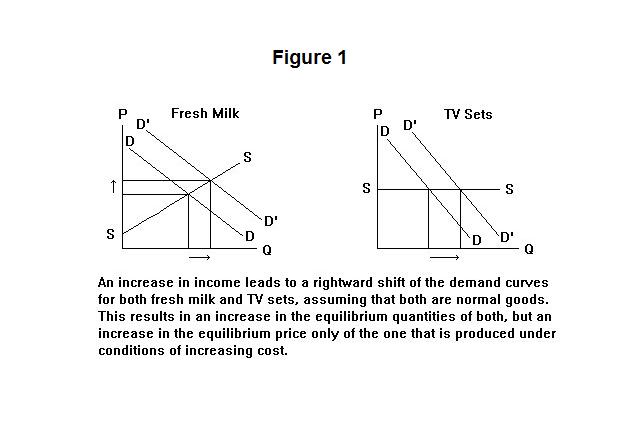
Figure 1 examines the effects on the price and quantity of
fresh milk and TV sets of an increase in consumers' incomes.
The supply curve of fresh milk is portrayed as upward sloping
to reflect the effects of diminishing returns. The supply curve
of TV sets is portrayed as horizontal to reflect the fact that
there are no diminishing returns in that industry. Fresh milk
is produced under increasing costs and TV sets are produced
under conditions of constant cost.
Under the assumption that both fresh milk and TV sets are normal goods, the increase in consumers' incomes shifts both demand curves to the right. The equilibrium price rises in the increasing cost industry and remains constant in the constant cost industry. Equilibrium quantity increases in both cases.
Figure 2 examines the effects of technological improvements in the two industries.
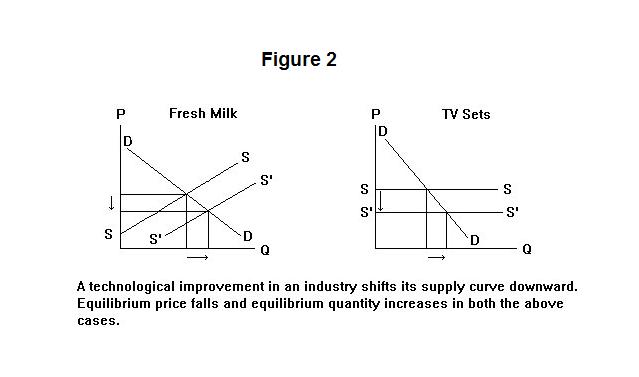
Improvements in technology lower the cost of producing each level of output, shifting the supply curves of both goods downward. The equilibrium price falls in both industries and the equilibrium quantity increases in both.
In analyzing the effects of shifts in demand and supply it is necessary to keep in mind the perspective from which changes in price and quantity are to be viewed. For example, suppose that we are interested in the price and output of wool in New Zealand. The supply of New Zealand wool will be an upward sloping curve reflecting the diminishing returns to labor and capital that occurs in the production of agricultural products. The demand for New Zealand wool will not, however, be the usual downward sloping curve that reflects the substitution of wool for other goods on the part of consumers as the relative price of wool falls. The reason is that, important as wool is to New Zealand's economy, that country produces only a tiny fraction of world wool production. Wool is an internationally traded commodity whose price will be determined in the world market, as shown in the right panel of Figure 3. The world supply of wool will be upward sloping and the world demand for wool downward sloping for the usual reasons. The interaction of the world supply and demand for wool will determine the world price of wool. New Zealand produces such a small fraction of world wool output that even a doubling of her production would have little effect on the world supply and hence the world price. So the demand curve faced by New Zealand wool producers is essentially a horizontal line at the world price, as shown in the left panel of Figure 3.
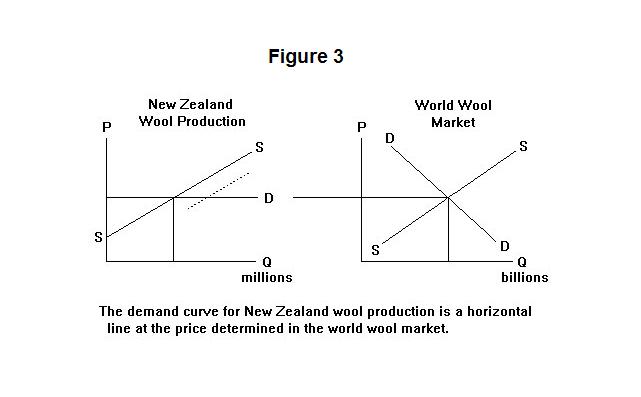
A technical improvement in New Zealand wool production will thus lead to an increase in the quantity of New Zealand wool produced and an equivalent increase in the quantity of wool produced in the world as a whole, of which New Zealand constitutes a part. The proportional effect of the increase in New Zealand's wool output on the world supply will be so small as to leave the aggregate world supply essentially unchanged. As a result, the price of wool in the world as a whole and in New Zealand will remain essentially unchanged in the face of variations in New Zealand's output. This can be seen by shifting New Zealand's supply curve downward in the left panel of Figure 3.
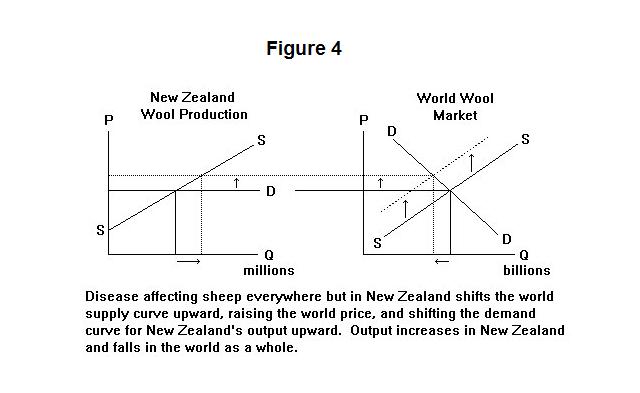
Suppose now that a disease affecting sheep spreads through the world but that New Zealand, being an island, manages to keep free of it. The effect of the disease will be to increase the cost of producing wool at each world output level, shifting the world supply curve upward. Given unchanged world demand, the world price will rise and the horizontal demand curve facing New Zealand producers will shift up. This can be seen by shifting the world supply curve, and New Zealand's demand curve, upward in Figure 4 as indicated by the dotted lines. New Zealand's wool output will increase, while output in the world as a whole will decline.
Now consider the demand for wool in New Zealand and the supply of wool to New Zealand consumers. These are shown in the left panel of Figure 5. When the price of wool falls consumers in New Zealand, like consumers elsewhere, will substitute wool for other products that can be used to produce garments. The demand for wool on the part of New Zealand consumers will thus be downward sloping. Since New Zealand consumers constitute a small part of the overall world demand for wool, shifts in income and other factors affecting their demand for wool will have an imperceptible effect on the world demand and the world price.
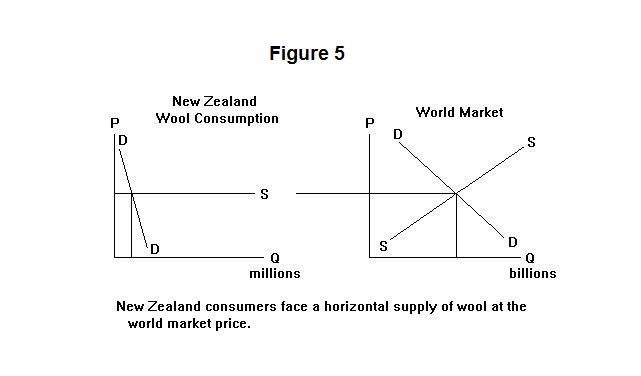
New Zealanders can therefore purchase pretty much all the wool they want at the fixed world price. The supply curve for wool facing New Zealand consumers is thus essentially a horizontal line at the world price.
Figure 6 portrays the participation of New Zealand in the world wool market on both the demand and supply sides.
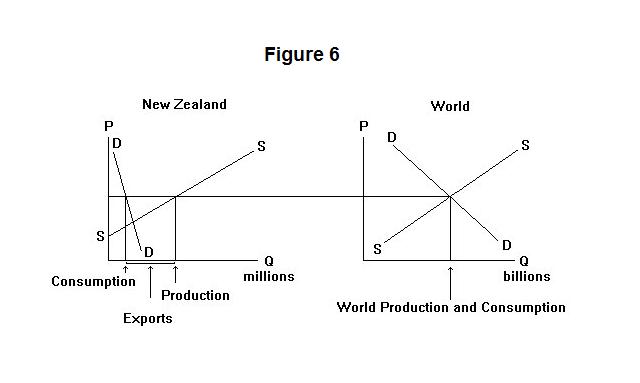
The world demand and supply determine the world price of wool. Since New Zealand producers produce a tiny fraction of the world supply and consumers consume a tiny fraction of the world demand the price of wool is largely independent of what New Zealanders do. Since New Zealand is a major wool producing country (even though she produces a very small fraction of the world supply) she produces much more wool than her residents consume. This excess of production over consumption, shown in the left panel of Figure 6, is exported for sale on the world market. Shifts in the supply and demand for wool in New Zealand will lead primarily to changes in the level of her wool exports and have virtually no effect on the world price.
As the above analysis indicates, the shapes of the supply and demand curves are of fundamental importance in analyzing the determination of price and quantity in particular contexts---one cannot routinely apply the principle that demand curve or supply curve relevant to a particular situation always slopes downward or upward respectively. The demand curve facing producers may not be the demand curve of consumers in the same region or country. And the supply curve facing consumers may not be the supply curve of that region's or country's producers. We therefore cannot assume that the quantities produced and consumed in any particular location will necessarily be the same.
Before proceeding to a test on this topic, it is useful to reflect on whether one can obtain information about supply and demand curves from observed price-quantity combinations. Consider the left panel of Figure 7. The heavy dots represent observed price-quantity combinations. One could draw a downward sloping line through these dots and assume that they trace out a demand curve. As the upward sloping unlabeled supply curves in that panel show, the array of price-quantity combinations could have resulted from downward shifts of the supply curve on the demand curve DD.
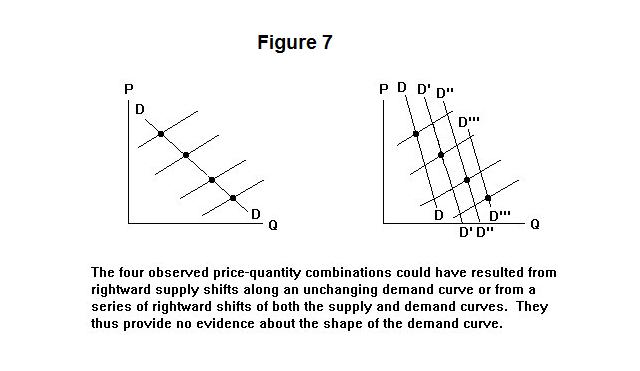
Exactly the same price-quantity combinations are given by the dots in the right panel of Figure 7. There we drew demand and supply curves that give a different interpretation of the circumstances that generated those price-quantity combinations. These combinations could have been generated by rightward shifts of both the demand and supply curves.
The same dots thus imply a steeper demand curve under the interpretation in the right panel of Figure 7 than they do under the interpretation in the left panel of that Figure. We must conclude that simply looking at the price-quantity combinations generated in the market tell us nothing about the shapes of the demand and supply curves. Sophisticated statistical techniques are required to extract information about the slopes of the supply and demand curves from price-quantity data.
It is test time again. As always, think up your own answers before looking at the ones provided.
Question 1
Question 2
Question 3
Choose Another Topic in the Lesson.