A fundamental issue which now must be faced is the benefits and costs of
unregulated free enterprise. In a world where producing each product in sufficient
quantity requires many firms, unregulated free enterprise
will be the most efficient organization of economic activity. This can
be shown with reference to the figure below, which focuses on a typical firm.
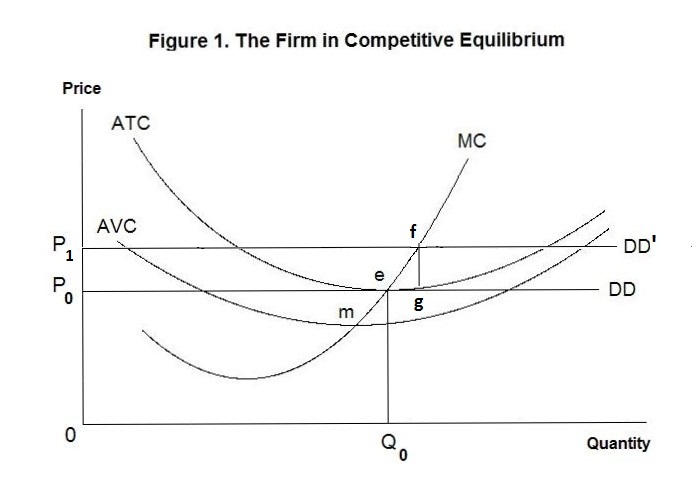
The curve AVC gives the firm's average variable cost curve. Total variable costs increase at an increasing rate as output increases. Average variable costs---that is, total variable costs divided by the quantity of output produced---falls as output increases when output is low and rises as output increases when output becomes large. The minimum point on the average variable cost curve is at point m. The firm also has fixed costs, which are independent of the level of output---average fixed costs thus decline continuously as output increases. When we add average fixed costs to average variable costs we obtain the average total cost curve, denoted as ATC. Since average fixed costs become smaller as output increases, so does the vertical distance between the AVC and ATC curves---the minimum point on the average total cost curve, at point e, thus occurs at a higher level of output than the minimum point on the average variable cost curve. The marginal cost curve, denoted as MC, gives the change in total cost associated with a one unit change in output. It is equal to average variable cost when average variable cost is at its minimum---at that point a small change in output increases total variable costs in the same proportion as that increase in output, thereby having no effect on average variable costs. And, for the same reason, marginal cost is equal to average total cost when average total cost is at its minimum. Thus, the marginal cost curve rises continuously as output increases beyond some level below that where average variable cost is minimum.
When there is perfect competition and the output good produced be each firm is identical to that produced by all other firms, as well as a small fraction of the total produced of the product in question, the individual firm's demand curve is a horizontal straight line, denoted in Figure 1 by DD. Each firm will increase its output whenever the increase in its total revenue from producing an additional unit exceeds the increase in its total cost---that is, whenever marginal revenue exceeds marginal cost. Since the price of the firm's output is unaffected by the amount it produces, its marginal revenue is everywhere the same, and equal to P0 where the DD line crosses the vertical axis. Where all firms have identical total cost curves, firms will enter the industry, with the additional output driving the price down until all firms are producing at the minimum points on their average total cost curves where marginal cost equals price.
Of course, in the real world some firms will be better managed than others with the result that their total costs are lower. This means that their minimum average total cost will be less than the market price. They will produce where marginal cost equals price and earn a slight additional profit. We can think of this profit as a return on managerial skill which could be earned in some other industry as well as in this one. Accordingly we can include that profit as a cost of production and simply add it to the firm's total cost. The minimum point of this new total cost curve will then be equal to price and Figure 1 will continue to present a correct picture.
Firms that can earn a revenue above their costs will enter the industry and firms whose minimum average cost exceeds the price will leave. For example, if the price of the product is equal to P1 as denoted by the P1 DD' line, new firms that are as efficient as the one diagrammed will enter the industry to earn an initial excess profit per unit equal to f g. Quantity will increase and the price will fall until it reaches the minimum average total cost of the entering firms, assumed here to be identical to those firms already in the industry.
Since the price equals the value to buyers of the last unit purchased, and the marginal cost equals the cost to society of that last unit, it will be optimal for these to be equal and also equal to the minimum average total cost. If price exceeds marginal cost, the last unit of output is worth more than the cost of producing it and there is therefore a social gain from producing another unit. If price is less than marginal cost, the last unit of output is worth less to society than the cost of producing it and should not be produced. Under free enterprise, the price will equal the marginal cost of all firms and the level of output will be optimal. Since price will ultimately also be equal to the minimum average cost, there will be an optimum number of firms in the industry.
In fact, there will be many inefficiencies in a real-world free-enterprise system. First, some products will be produced by a small number of firms who will collude to engage in monopoly pricing and some products will be produced by only a single firm, which will have a natural monopoly. The effects of there being a monopoly in a particular industry is shown in the figure below.
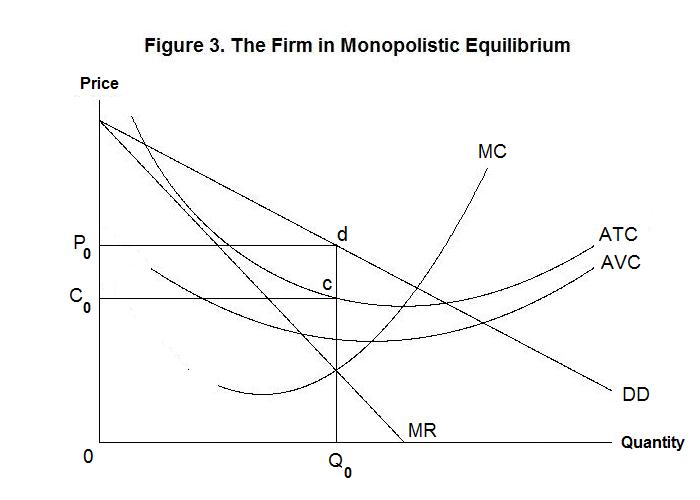
The demand curve facing this firm is the downward sloping straight line DD rather than a horizontal line. The marginal revenue curve is now the line MR which at each price is half the distance between DD and the vertical axis. As before, profits will be maximized at the output where marginal cost equals marginal revenue. This will occur at output Q0 and the monopoly profit will be the area of the rectangle P0 d c C0 The monopoly firm produces a level of output that is non-optimal from the social point of view. At output Q0 the social benefit of the last unit produced is given by the distance between point d and the quantity axis and is equal to the amount people are willing to pay for it, which is the amount of other goods they are willing to give up to have it. The social cost of the last unit produced is the distance between point e and the horizontal axis, which gives the amount of other goods that could be produced with the resources used to produce this last unit. The social benefit of the last unit thus exceeds the social cost. As additional units of the good are produced the benefit of the last unit declines and the cost of the last unit increases. But the benefit will still exceed the cost until the point a is reached. The net social benefit of producing additional units equals the distance between the demand curve and the marginal cost curve at that level of output. Accordingly if output is increased until the point a is reached the net benefit achieved will be given by the area d e a. This is the efficiency cost of monopoly--the value of the additional output society could produce by eliminating it.
It is not necessarily true that a firm having a monopoly will earn profits in excess of what could be earned under competition. A zero-profit-making monopoly firm is presented in the figure below.
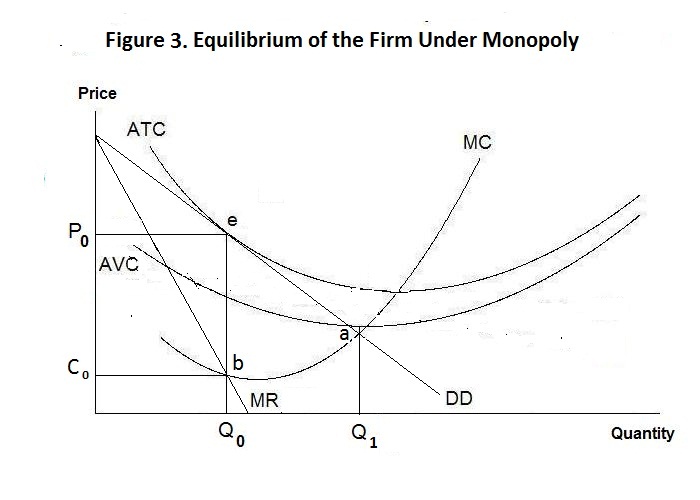
The firm produces where its marginal revenue equals its marginal cost, at output Q0 , charging a price that turns out to be equal to its average total cost at point e. The socially efficient output is Q1 where the marginal cost equals price at point a. Since the firm will earn negative profits at that point the achievement of social efficiency will require a govenment subsidy equal to the excess of average total cost over price at that output.
One can easily visualize a situation where the firm has a demand curve that is a tiny bit lower than the one in Figure 3, in which case it will not produce at all. Yet an optimum output will still exist where the marginal cost curve crosses the demand curve and marginal cost therefore equals price if the area that is under the demand curve but above the marginal cost curve is positive. Here a subsidy would be required for the firm to exist!
There are many more social inefficiencies of a free market system. The most obvious and important ones arise because the the presence of externalities whereby there are costs of producing a good that must be borne by people other than those producing it or benefits from a good being produced that accrue to persons other than those producing it. An obvious externality of the first type arises out of smoking. People who smoke get their nicotine fix at the risk of eventually developing lung cancer while other people around them who breathe in the second-hand smoke also have a high probability of developing lung cancer even though it was not their choice to smoke. Another example of a negative externality is the fact that firms extracting oil from the oil sands produce in the process hydro-carbons that will cause global warming and eventually lead to the destruction of life on earth. A positive externality would arise if fire protection were provided by individual firms in a free market. If the house of a person who hires a fire-fighting firm catches on fire, the firm will put out the fire. If the house next door catches on fire the fire protectors will also put that fire out even though the person owning the house next door has not purhased fire protection because there will be a high probability of the fire spreading to the house that the fire protectors are being paid to protect. People can thus free-ride off neighbors who purchase fire protection for their property. Another positive externality arises with respect to education. One benefits from learning to read by more when other people who are in contact also have learned to read!
It is test time. As usual, think up your own answers before looking at the ones provided.
Choose Another Topic in the Lesson