It is now time to take a look at the interest rate and inflation experience
of a number of countries to see if the empirical evidence is consistent with
the ideas developed in this lesson. Let us begin with the United States.
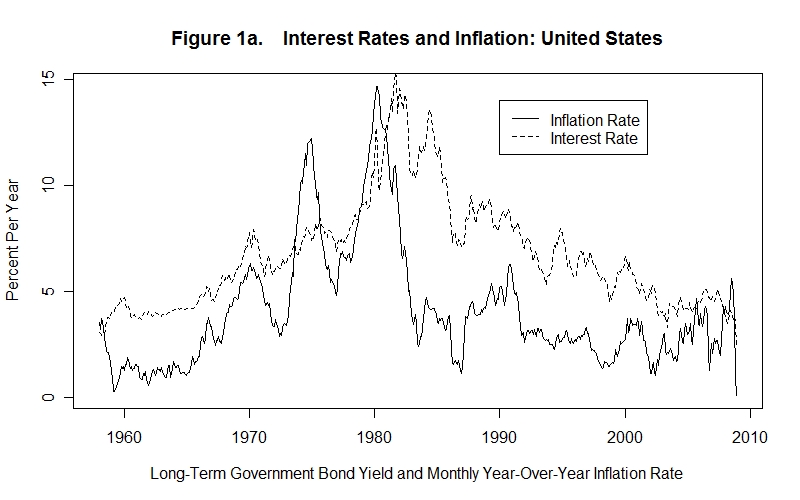
Figure 1a plots the year-over-year rate of inflation (of the CPI), calculated
on a monthly basis, and the corresponding annual yield or effective nominal
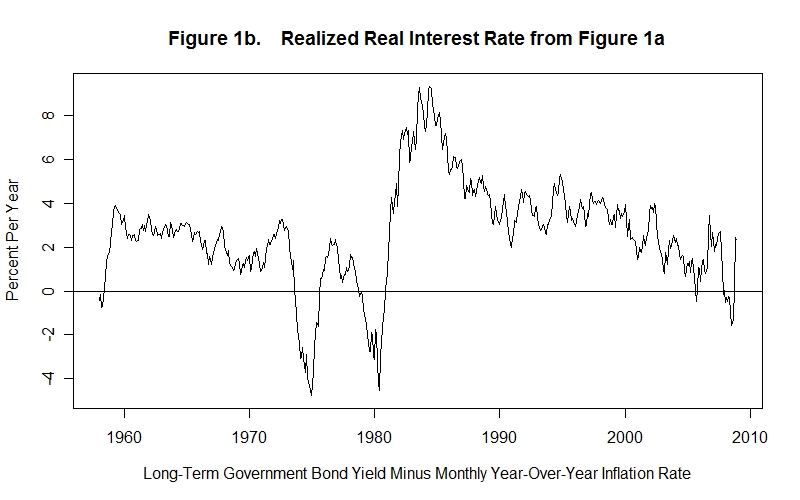
interest rate on U.S. Government long-term bonds. Figure 1b plots the the
realized real interest rate calculated by subtracting the actual inflation rate
from the long-term bond yield.
Three facts are evident from Figures 1a and 1b. First, the nominal interest rate on long-term U.S. government bonds showed an upward trend from 1960 to the early-1980s and then a downward trend thereafter. Second, the U.S. inflation rate showed the same upward trend from 1960 to the early-1980s although the variability around trend was much greater then that of the interest rate. Following the early-1980s the inflation rate fell sharply and then varied substantially around a very shallow downward trend thereafter. Third, the realized real interest rate fell sharply into negative territory, and then recovered, twice between the early-1970s and early-1980s, and then shot upwards to around 9 percent, showing a downward trend thereafter, temporarily falling below zero in September 2005 and again in November 2007 and during the first nine months of 2008.
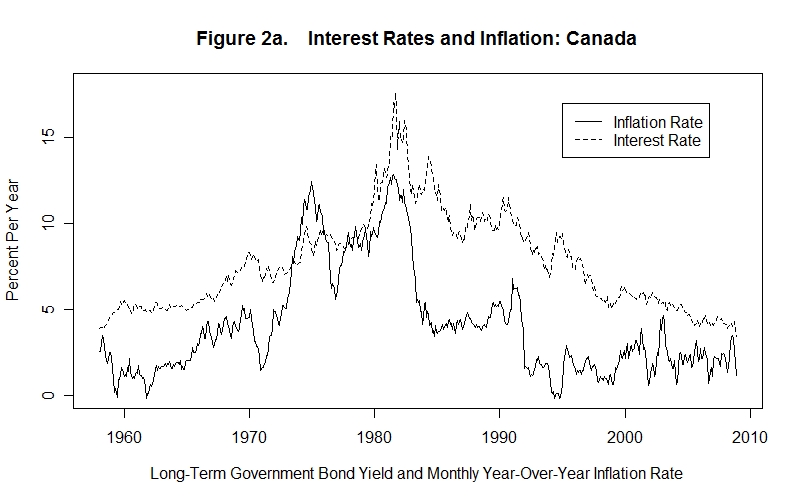
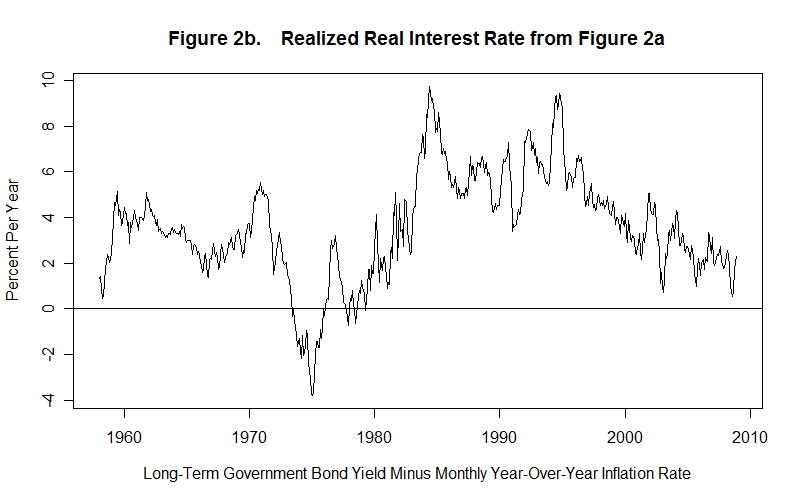
Figures 2a and 2b plot the same data for Canada. The pattern is similar to the U.S. case. Nominal long-term bond yields exhibited a rising trend from 1960 to the early 1980s and then a downward trend thereafter. The inflation rate showed the same general pattern as that of the U.S. although it fell more sharply in the mid-1980s than did the U.S. inflation rate. And, as in the U.S., it was more variable than long-term government bond yields. The realized real interest rate fell briefly into negative territory in the mid-1970s and then peaked in the early-1980s as did the U.S. realized real interest rate. Unlike the U.S., however, the Canadian realized real interest rate maintained a high average level all the way to to the mid-1990s and then entered a downward trend to average levels similar to those in the U.S. after the year-2000, but never becoming negative.
How do we explain these movments of nominal and real interest rates? Notice first that the inflation rates in Canada and the United States show the same trend movements as long-term bond yields---the trends are upward from 1960 to the early-1980s and then downward thereafter. In the absence of trends in the two countries' contracted real interest rates, these upward trends in inflation rates before the early-1980s, and downward trend thereafter, easily explain in very broad terms the overall movements in nominal interest rates.
But how do we know that there were no upward, and subsequent downward, trends in the two countries' contracted real interest rates? Look at the realized real interest rates in Figures 1b and 2b, They show no upward trends between 1960 and the early-1980s. While the contracted and realized real interest rates will usually differ, we would be surprised to observe a long-term trend in one without a similar long-term trend in the other---people will not systematically make unidirectional errors in predicting the rate of inflation over a 25-year period. This suggests that the trends in the contracted real rates of interest were flat.
Not only are the upward trends in bond yields prior to the early-1980s consistent with the upward trends in inflation rates, but the sharp drop in yields thereafter can be directly attributable to the sharp drop in the two countries' inflation rates. Asset holders observed the movements in actual inflation rates and adjusted their expected inflation rates accordingly.
Now, what about the decline in realized real interest rates, on occasion to negative levels, in the 1970s? Notice that there were sharp peaks in inflation rates around 1973 and 1980 in both countries. These correspond closely with the two episodes of negative realized real interest rates in the United States shown in Figure 1b and the negative realized real interest rate in Canada in 1974 in Figure 2b. It appears that these sharp upward movements in the inflation rate were unanticipated with the result that nominal interest rates did not adjust immediately to accommodate them, although over the long-run nominal interest rates did adjust to reflect the trend rates of inflation.
It is not surprising that asset holders did not expect the sharp increases in rates of inflation in 1973 and 1979---inflation rates of this magnitude were unheard of during the preceding 20 years of price stability.
Once high rates of inflation became anticipated and nominal interest rates rose by the early 1980s to accommodate them, inflation rates began to decline. Nominal interest rates responded to these inflation rate changes again with a lag, though the lag was shorter than previously when inflation rates were rising. Realized real interest rates were still high in 1990 relative to historic levels, particularly in Canada.
There are two possible, and conflicting, explanations for this failure of realized real interest rates to fall back in the late 1980s to levels experienced earlier. One explanation is that expected inflation rates were still high and therefore above actual inflation rates---asset holders did not believe that the fall in inflation rates was permanent. The other explanation is that contracted real interest rates were higher than they had traditionally been. We cannot distinguish between these two explanations on the basis of the data presented here.
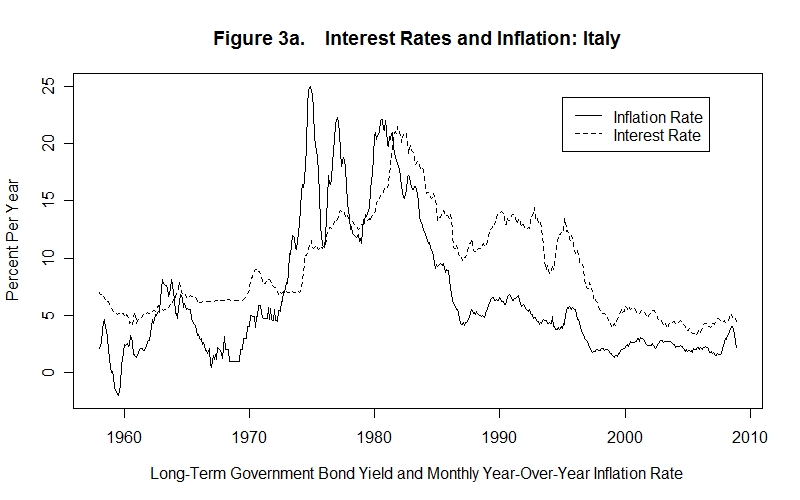
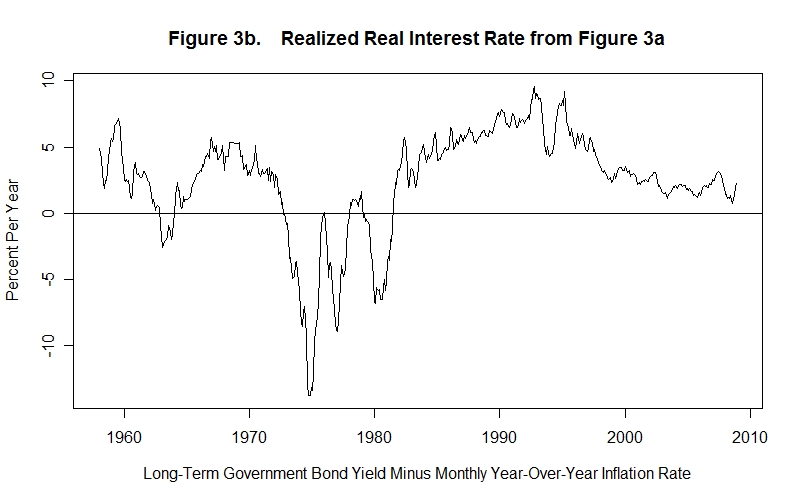
The experience of Canada and the United States is strikingly similar to that of many other countries. Interest rates and inflation rates for two additional countries, Italy and New Zealand, are shown in Figures 3a and 3b and Figures 4a and 4b. Both countries experienced upward trends in long-term bond yields and inflation rates between 1960 and the 1980s. Thereafter, Italy's bond yields fell along with her inflation rates in similar fashion to developments in Canada and the U.S. Italy also experienced substantial declines in realized real interest rates in the 1970s and early-1980s with those rates frequently entering negative levels, and then a sharp recovery and steady rise in realized real interest rates in the late-1980s and early-1990s.
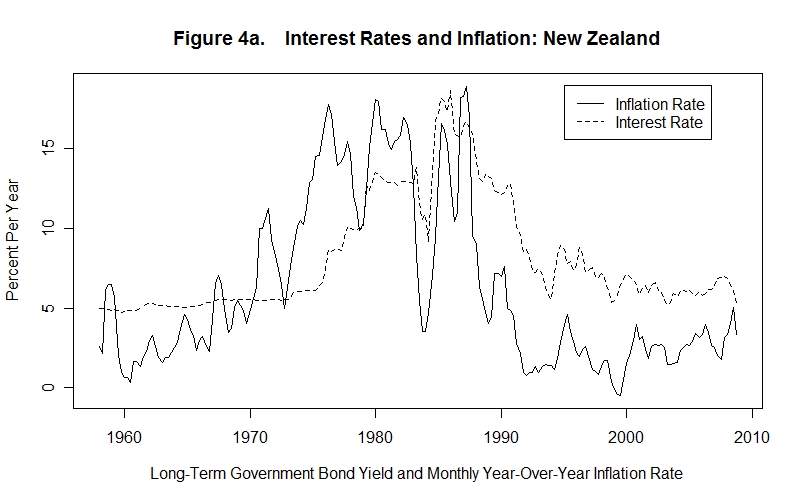
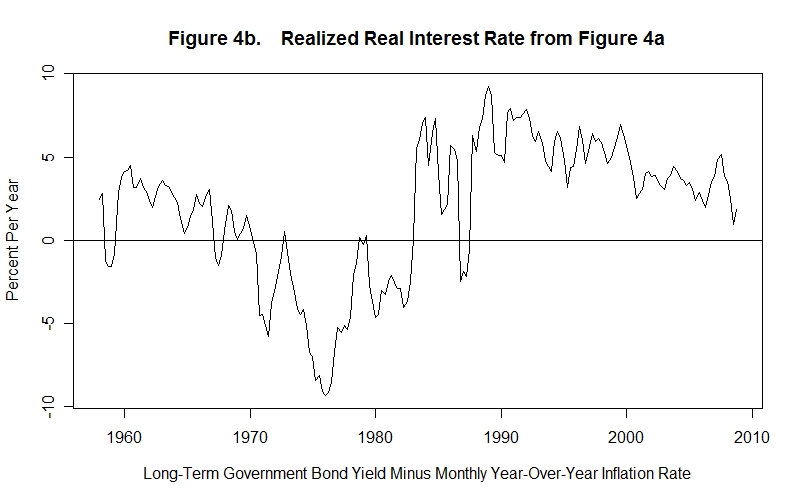
New Zealand experienced three peaks in her inflation rate, and three troughs in the realized real interest rate---in the mid-1970s, the early-1980s, and in the late-1980s---that correspond to those inflation peaks. The sharp drop in the inflation rate in 1983-84 matched a sharp peak in realized real interest rates. New Zealand's bond yields increased sharply relative to 1980 levels with the resumption of high inflation in 1986-87 and were still high in 1990 as compared to historic levels. As of that year, long-term bond yields were at 1980 levels even though the inflation rate had again fallen---asset holders apparently remained unconvinced that the bout with high inflation was over.
An interesting question is whether nominal interest rates tend to be higher in countries experiencing a lot of inflation than in countries experiencing less inflation. We would expect this to be the case among the major industrial countries because capital is free to move among them in response to any emerging expected real interest rate differences. Contracted real interest rates should therefore be roughly the same everywhere, with the result that nominal interest rates should differ in the same direction as actual inflation rates.
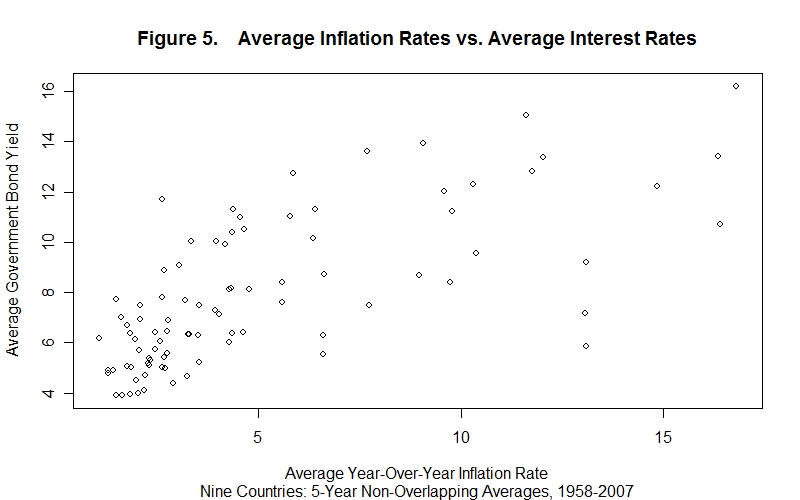
Figure 5 presents a scatter plot with 5-year average year-over-year inflation rates on the horizontal axis and average long-term government bond yields for the same 5 years on the vertical axis. The periods taken were the non-overlapping half-decades 1958-62, 1963-67, 1968-72, 1973-77, 1978-82, 1983-87, 1988-92, 1993-1997, 1998-2002 and 2003-2007. Data for 9 countries (United States, Canada, United Kingdom, Belgium, France, Germany, Italy, Australia and New Zealand) are included.
The scatter shows a roughly positive association between 5-year average inflation rates and average bond yields for the same 5-year periods. The positive relationship is far from exact, of course, as we would expect, because the 5-year average expected inflation rates need not correspond to the 5-year average actual inflation rates. Were one to plot yearly bond yields against year to year actual inflation rates the correspondence would be much looser, if recognizable at all, because actual and expected inflation rates are likely to differ widely in any one year.
The evidence is consistent with rough similarity of contracted real interest rates across industrial countries and differences of nominal interest rates that reflect the substantial differences in inflation rates both across countries and through time. If one observes a difference in interest rates between two countries, the first (though not the only) place to look for an explanation is at the difference in their inflation rates.
It is now time for a test on this topic. As always, commit yourself to an answer in every case before looking at the one provided.
Question 1
Question 2
Question 3
Choose Another Topic in the Lesson