It is now time to take a look at some of the evidence on
how spot and forward exchange rates behave in relation to each
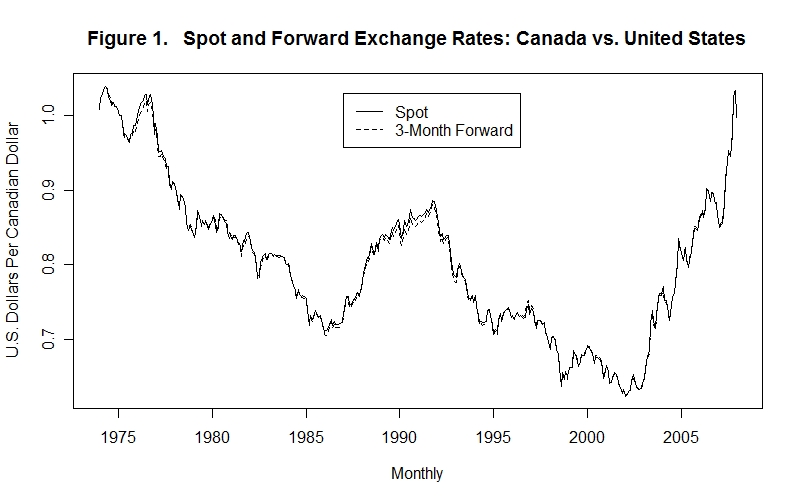
other and to international interest rate differentials. Figure 1
shows the spot and 90-day forward prices of the Canadian dollar in
terms of the U.S. dollar from 1974 onward. Notice that the spot
and forward exchange rates are so close together that the difference
between them hardly ever shows up on the chart. The same close
relationship holds for the spot and forward exchange rates between
most currencies.
Notice also in Figure 1 the very substantial variability of Canada's exchange rate with respect to the U.S. dollar. The price of the Canadian dollar in U.S. dollars fell (the Canadian dollar depreciated) by more about 30 cents between 1974 and 1985, rose by more than 15 cents between 1985 and the early 1990s, then fell by more than 20 cents by 2002. Finally, it rose by about 40 cents between 2002 and the end of 2007. This degree of variability was also present in the exchange rates of most other countries from the early 1970s onward.
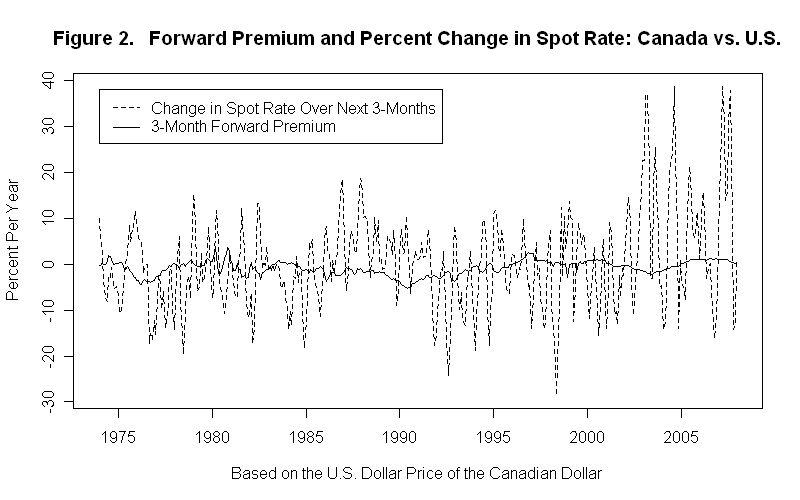
Figure 2 plots the 3-month forward premium on the Canadian dollar and the percentage change of its spot price in terms of the U.S. dollar over the subsequent three months. Notice the tiny fluctuations of the forward premium in relation to the fluctuations in the corresponding future changes in the spot rate, a fact that is also true for most other countries' exchange rates. This suggests that the forward rate is not a very good predictor of the future spot rate. One reason might be that asset holders do not have good information about the factors affecting exchange rates.
Suppose we consider two alternative forecasts of the future spot rate: 1) that the spot rate three months from now will be the same as the spot rate today; and 2) that the spot rate three months from now will equal today's 3-month forward rate. The second forecast assumes that markets are efficient in the sense that participants use as best they can all information available to them and that there is no foreign exchange risk. The first forecast is a simple naive projection that assumes that market participants have no useful information about future exchange rate movements. Figure 3 plots empirical probability densities of the percentage forecast errors of the two forecasts using monthly data for Canada for the period January 1974 through November 2007.
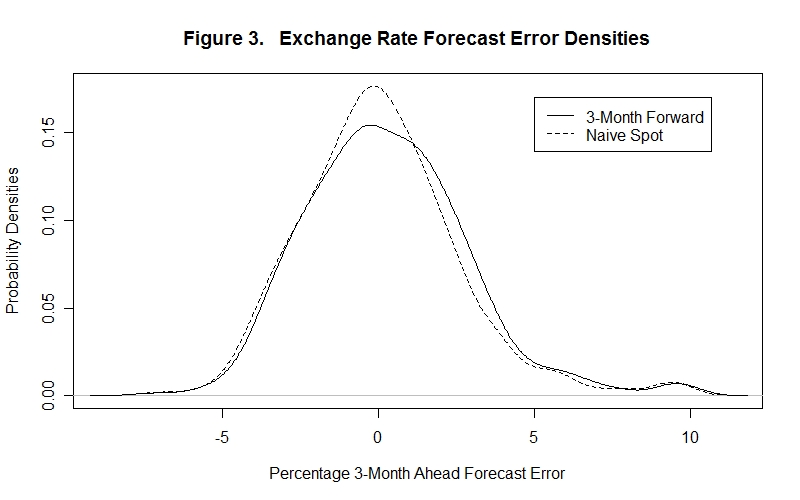
The horizontal axis denotes the percentage forecast error. The vertical distances from the horizontal axis to the curves give the probabilities of occurrence of the percentage errors measured on the horizontal axis. The areas under the curves to the left (or right) of a given percentage forecast error give the probabilities that the forecast errors will be less than (or more than) that particular magnitude---the entire area under each density curve is unity. From looking at the graph it would seem that a naive assumption that the exchange rate will equal its current level three months hence does a bit better than using the current forward rate as a prediction of where the exchange rate will be at that time. Indeed, it turns out that the average forecast error is .04 percent using the naive forecasting method and .27 percent using the current forward rate as the predictor, so that both forecasts tend on average to be too high. And the variance forecast errors---that is, the sum of the squared errors divided by the number of observations---is 6.49 percent for the forecast based on the naive assumption that the spot rate will be the same three months hence as it is now and 6.82 for the forecast based on the assumption that in three months the spot rate will equal today's 90-day forward rate. This rather slight inferiority of forward rate forecasts over naive projections is also a characteristic of exchange rate behavior in most other countries that experience stable inflation rates.
The interest parity condition tells us that the excess of the domestic interest rate over the foreign interest rate should equal the forward discount on the domestic currency plus a country-specific risk premium. If the risk premium is zero, the interest rate differential and the forward discount should be the same. Figure 4 plots the excess of the interest rate on 90-day commercial paper in the United States over the 90-day commercial paper rate in Canada together with the 3-month forward premium on the Canadian dollar in terms of the U.S. dollar. Apart from a couple of one-month spikes in the forward premium, the correspondence of the two series is quite close. The spikes would appear to be the result of problems measuring the spot rate. These data problems depend on what time of day the spot rates are chosen and how many different transactions are averaged to obtain the spot rate measure. Overall, the correspondence of the interest rate differential and forward premium suggests, not surprisingly, that the country-specific risks in the two countries have been very similar.
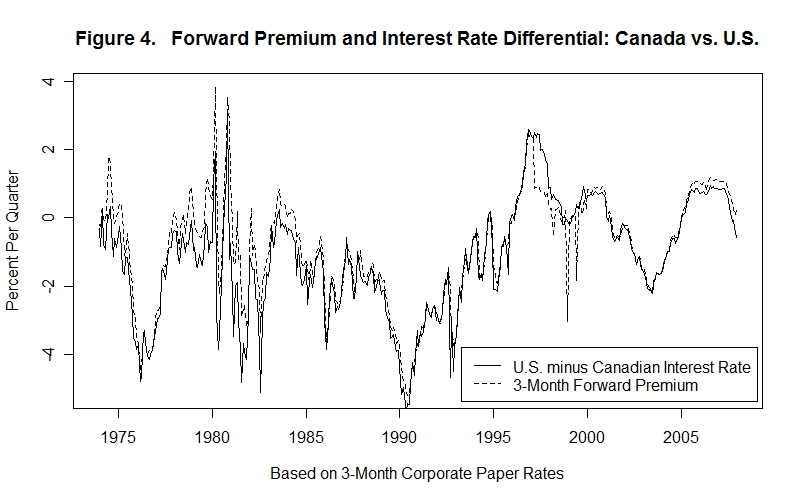
Although the evidence in Figure 4 pertains only to a Canada/U.S. comparison, the same pattern also holds for other combinations of countries that do not place government restrictions on international asset transfers. This is especially true when the interest rate differentials are on securities issued in both currencies by the same firm and by issuers in third countries, thereby minimizing country risk.
One reason why the forward price of the U.S. dollar in terms of the Canadian dollar does a poor job of forecasting the future spot price is that the Canadian and U.S. inflation rates are very similar. If the Canadian inflation rate were, say, 10 percentage points greater than the U.S. inflation rate we would expect that, other things equal, the Canadian dollar would be depreciating in terms of the U.S. dollar at the rate of 10 percent per year. Even if asset holders had no other information about the other factors likely to cause future exchange rate movements they would still discount the Canadian dollar forward by about 10 percent. So we would expect that countries having high inflation rates will tend to have relatively high interest rates and that their currencies will tend to trade forward at a discount.
There is, indeed, considerable evidence that nominal interest rates tend to be higher in countries experiencing a lot of inflation than in countries experiencing less inflation. This would be the case if the risks of holding the various countries' assets are not too different and actual inflation rates are good predictors of expected inflation rates. Figure 5 presents a scatter plot with 5-year average inflation rates on the horizontal axis and average long-term government bond yields for the same 5 years on the vertical axis. The 10 five-year periods taken were the non-overlapping half-decades between 1958 and 2008. Data for 9 countries are included, for a total of 90 observations. This figure is also presented, along with a list of the countries included, in the Lesson entitled Interest Rates and Asset Values.
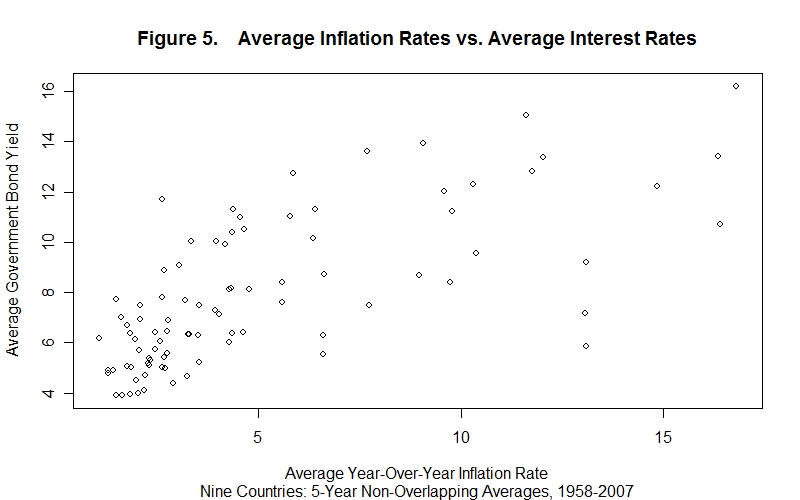
The scatter shows a positive association between 5-year average inflation rates and average bond yields for the same 5-year periods. The positive relationship is, of course, far from exact. There are two reasons for this. First, risk is not the same in all countries so their real interest rates will differ and vary from time to time. Second, nominal interest rate differentials will differ from real interest rate differentials on account of expected rather than actual inflation rates and the 5-year average expected inflation rates need not correspond to the 5-year average actual inflation rates. A simple ordinary-least-squares regression of the 5-year average interest rate differentials denoted by Y on the 5-year average inflation rates denoted by X for the 90 data points yields the following estimated equation:
where the P-value of the slope coefficient is less than .001 and the R2 is almost 0.5. The P-value gives the probability that a coefficient as large as the observed 0.515 could have been obtained on the basis of purely random chance if no relationship actually existed between Y and X and the R2 measures the percentage of the variations in Y that are explained by the variations in X.
The evidence is consistent with rough similarity of contracted real interest rates across industrial countries and differences of nominal interest rates that reflect the substantial differences in inflation rates both across countries and through time. The first, though not the only, place to look for an explanation of a difference in nominal interest rates between two countries is at the difference in their inflation rates.
It is now time for a test. As always, think up your own answers before looking at the ones provided.
Question 1
Question 2
Question 3
Choose Another Topic in the Lesson