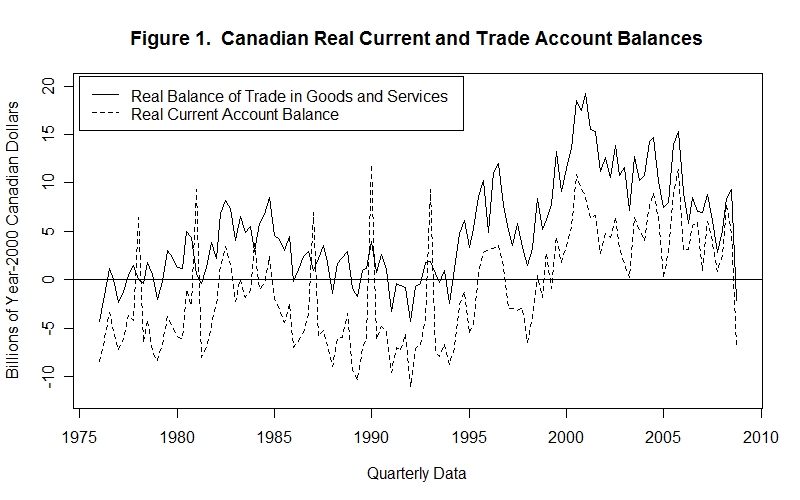
Now let us take a look at some of the evidence on the balance of payments
and real exchange rate. Figure 1 plots the real current account balance and
real balance of trade in goods and services, excluding the services of capital,
for Canada for the years 1976 through 2008.
Notice that, apart from some spikes that would appear to represent data
problems, the country ran current account deficits in all but a few years prior
to 2000 and, apart from the last quarter of 2008, surpluses thereafter. Prior
to the year 2000, capital was flowing into the country and thereafter it was
flowing from Canada to investments abroad. Notice also that apart from the
above-mentioned spikes, the real current account balance is always less than
the real balance of trade in goods and services other than the services of
capital. From the basic equation
where CAB is the current account balance, TAB is the trade account balance and DSB is the debt service balance, the fact that CAB < TAB indicates that the debt service balance was everywhere negative---that is, Canadians were paying interest and dividends to foreigners on the negative balance of indebtedness that has been built up over the years.
For most of its history, Canada has had investment opportunities in excess of those that could be financed with Canadian savings. Foreign savings were thus drawn into the country to permit the development of Canadian natural resources---otherwise, the market returns from investing in Canada would have exceeded the returns from investing elsewhere. The income flow from the foreign-owned portion of the additions to the domestically employed capital stock accrues to foreign investors and appears as a negative component of the debt service balance.
Since the real trade account balance has almost always been positive in the period examined, it follows that the current account deficit---that is, the negative current account balance---has generally been smaller than the negative debt service balance. This can be seen from the fact that the trade account balance must equal the current account balance minus the debt service balance---that is, from a manipulation of the equation above,
This means that foreign residents were, on average, plowing back some but not all of their earnings from Canadian employed capital into re-investment in Canada. A negative trade balance would have implied that Canada was borrowing back all foreign earnings on domestically employed capital and then some. Were the trade balance equal to zero, the negative debt service balance will be equal to the negative current account balance---that is
and all foreigners' earnings are being plowed back into Canadian investment.
As just noted, the large negative debt service balance reflects the rather extensive foreign investment in Canada over the years. One period in which capital inflows were especially important is the two decades before World War I during which the western prairies were settled. The real current account deficit and real exchange rate during these years are plotted in Figure 2. The current account balance was negative throughout implying, of course, an equal a positive capital account balance---that is, a capital account surplus, implying that Canadians were selling more assets to foreigners than they were buying from them. This positive net capital inflow in the latter part of the period was dramatic.
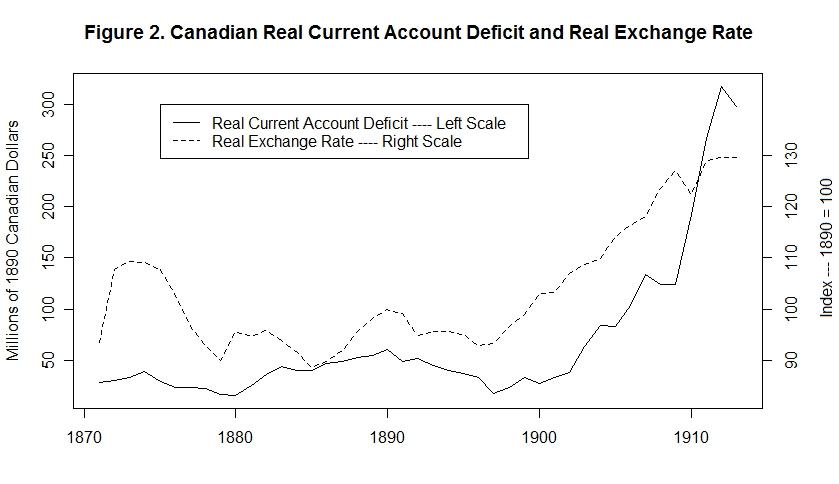
Notice also in Figure 2 the obvious positive relationship between the net
capital inflow and the real exchange rate---and, by implication, negative
relationship between the current account balance and the real exchange rate
---after 1896. Evidently, the capital movements (shifts in the vertical SI
line) were such a predominant influence that the upward movements in the real
exchange rate necessary to bring the current account balance into line with
them overwhelmed any real exchange rate movements that were necessary to
accommodate exogenous changes in desired exports and imports (shifts of the
BT curve). Such a strong relationship is unusual. A scatter plot of the real
exchange rate against the real current account balance for the period
1976 through 2008 is presented in Figure 3.
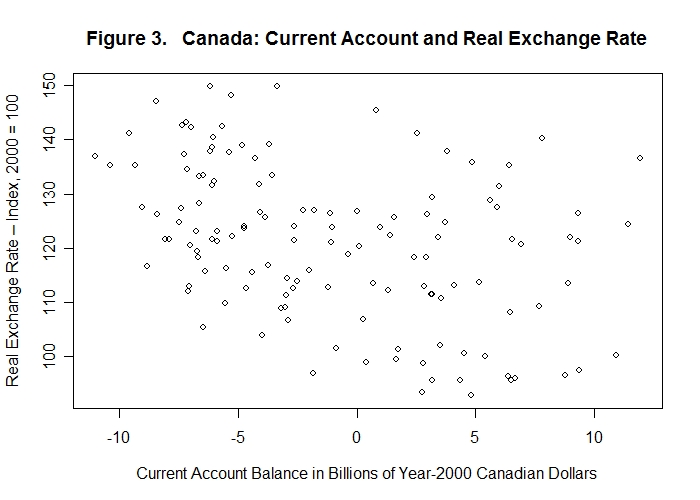
The relationship between the two variables is obviously very fuzzy. Yet a
simple ordinary-least-squares (OLS) regression indicates a significant negative
relationship although variations in the real current account balance explain
less than 16 percent of the variations in the real exchange rate---that is,
the R-Square is only .157. The coefficient of the real current account
balance is tiny, reflecting the scaling of the variables, but the probability
of observing a coefficient of that small magnitude if the real coefficient is
in fact zero---that is, the P-value---is less than .0000025. Of course,
the magnitude of the negative coefficient can be expected to differ
from the slope of the BT curve because the BT curve and the vertical SI line will both
have been shifting exogenously and independently---all that can be said is
that it appears that the BT curve has shifted back and forth by smaller amounts
than has the SI line.
An alternative perspective on the relationship between the real current account balance and real exchange rate is obtained from the time-series plot of the two variables presented in Figure 4. When we ignore the spikes in the real current account balance series as plausibly the result of data problems, a negative relationship between the two series is rather apparent prior to the year 2000.
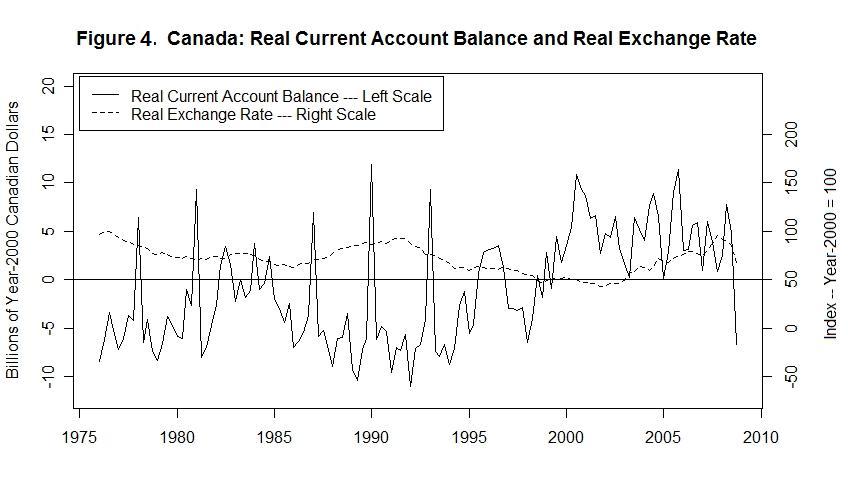
A more precise relationship could probably be obtained by comparing our real
exchange rate series, which is for Canada with respect to the United States,
with the real current account balance of Canada with respect to the United
States rather than with Canada's real current account balance respect to the
rest of the world. The fact that a rough relationship is found between the
not-quite-comparable series is undoubtedly due to the fact that the Canadian
economy is so closely connected to that of the United States with both
countries being the other's foremost trading partner.
Another force that can bring about equilibrium between the desired current account balance and desired net capital inflow is changes in income associated with variations in employment. The unemployment rate is plotted against the real current account balance in Figure 5.
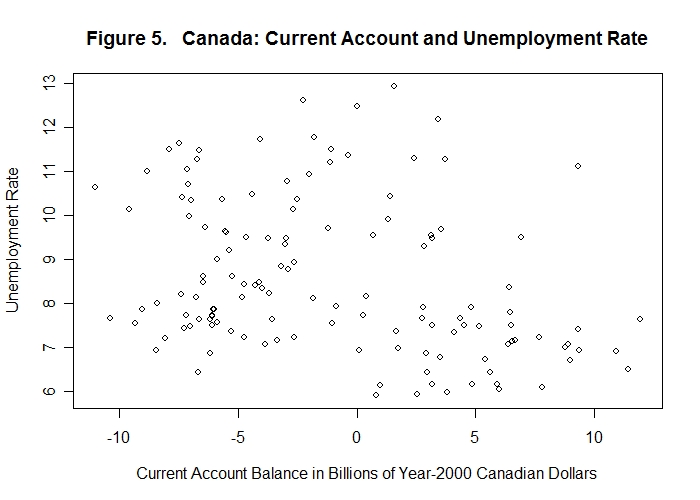
Again, the relationship is obviously very imprecise. An OLS regression
of the unemployment rate on the real current account balance produces a
negative and statistically significant estimated relationship---the
P-value is much smaller than .01---with an R-Square of only .10. In
this case, however, the sign of the relationship is contrary to what our
theory would predict. We would expect that the decline in real income
resulting from an increase in the unemployment rate would reduce imports and
increase the current account balance---that is, the relationship should be
positive. The fact that it is negative, and statistically significantly so,
is not inconsistent with our theory. A significant negative relationship could
simply be the result of much greater exogenous variations in the unemployment
rate, representing shifts in the NL curve, than in the real current account
balance as a result of shifts in the CA curve. Proper estimation of the
slopes of the relevant curves, and corresponding empirical verification of our
theory, requires the application of much more sophisticated econometric
techniques.
Now consider some evidence regarding the United States. The real current account and trade account balances for the U.S. for the period 1973 to 2008 are presented in Figure 6. To include a relevant real exchange rate in the analysis would require that we obtain the real exchange rate of the United States with respect to the rest of the world, a complex task beyond what is attempted here.
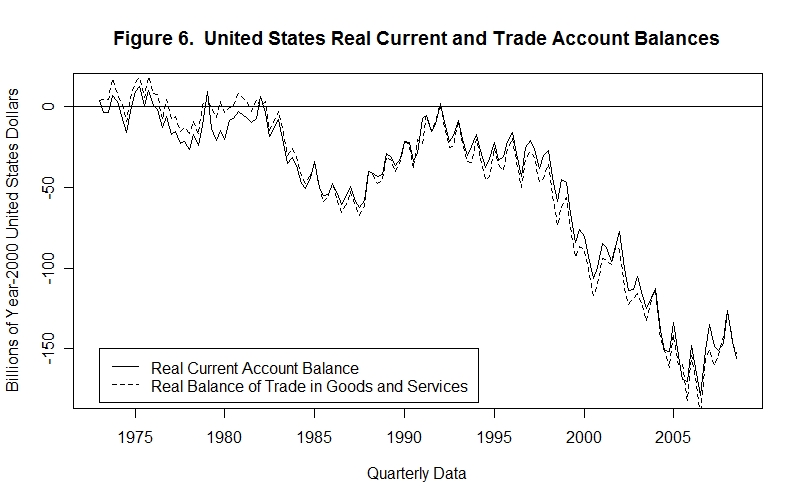
Unlike Canada, the differences between the real balance of trade in goods
and services and the real current account balance are relatively tiny,
indicating that the payments of income from domestically employed capital by
U.S. residents to foreign residents are not much different than the receipt
of income from foreign employed capital by U.S. residents.
The balance on current account averaged close to zero until about 1982 and then became negative. After bottoming out in the late 1980s, the balance recovered with the deficit all but disappearing in the early 1990s. Thereafter, the balance became increasingly negative with the deficit reaching 190 billion dollars in 2006. A very slight recovery followed during the subsequent two years. The evidence thus suggests that there was an increasing capital account surplus---that is, net sales of assets abroad---during the past decade and one-half. Does this mean that the United States became a better place to invest than other countries during the past fifteen years? Before jumping to that conclusion, we should look at what has been happening to U.S. savings. The fraction of United States income saved is plotted in Figure 7.

The fraction of income saved in the United States has exhibited a downwar
trend since the early 1980s. While this can account for the downward
trend in the real current account balance since the early 1980s there
appears to be no correspondence between the deviations of the two series
around their trends. This would suggest that shifts of world investment
into and out of the United States were also important determinants of
the pattern of variation in the real current account balance.
Now consider the relationship between the U.S. unemployment rate and that country's current account balance. As in the Canadian case, our theory would suggest a positive relationship if the exogenous shocks to the current account---that is, to the CA curve---were small relative to the shocks in income---that is, to the NL curve---leading to changes in the unemployment rate.
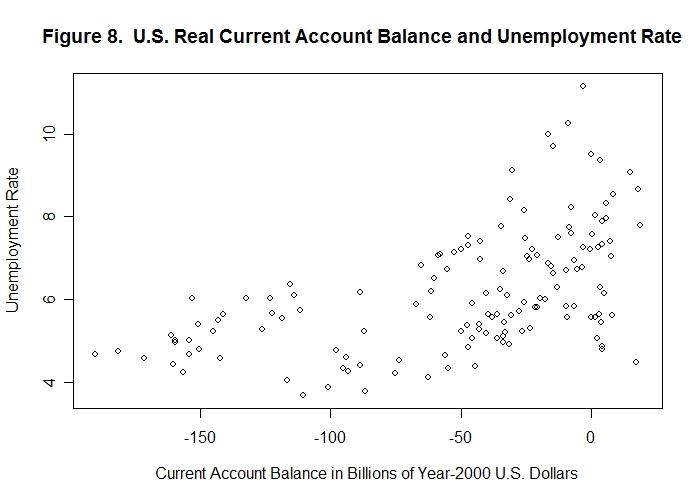
A very loose positive quadratic relationship appears to be present.
Using linear OLS regression of the unemployment rate on the real
current account balance as an approximation, a positive relationship is
clearly present with P-values way below .01 and an R-Square of more than
0.5. As in previous cases, of course, all that can be said is that
the exogenous variability of income represented by shifts in the NL
curve have been clearly greater than the exogenous variations in desired
exports relative to imports represented by shifts in the CA curve.
Finally, let us take a look at evidence for Japan. Figure 7 plots the real current and trade account balances for the period 1977 through mid-2008.
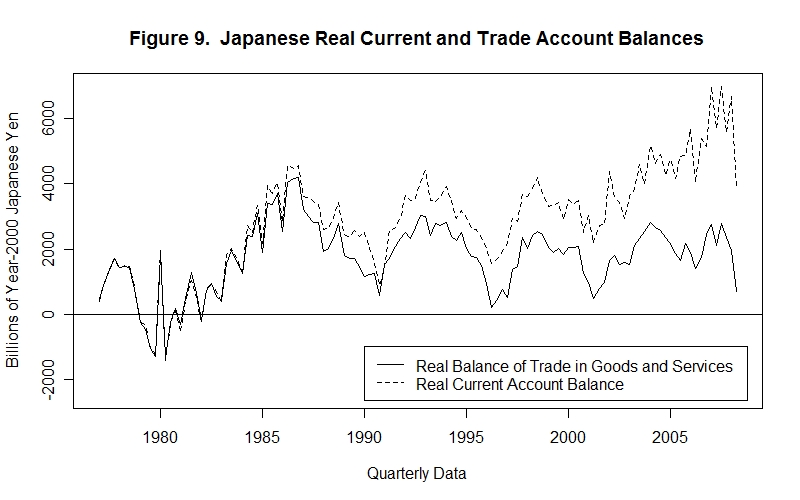
The real current account balance is uniformly above the real balance of
trade in goods and services, indicating that the country was a net
international creditor with a positive debt service balance. The increasing
difference since the early 1980s is consistent with the fact that the
real current account has been in substantial surplus, indicating that Japan
engaged in net lending abroad during the period. Continuation of this
lending will continue to increase Japan's net international creditor
position.
Figure 10 plots Japan's real current account balance on the left scale and the real exchange rate index (2000 = 100) on the right scale. The problem here is, of course, that the real exchange rate is with respect to the United States while the real current account balance is with respect to the entire rest of the world.
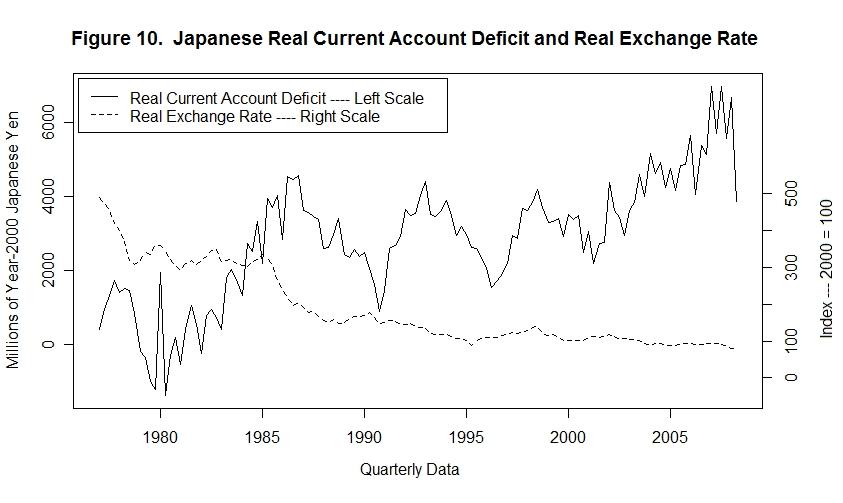
The clear upward trend in the real current account balance indicates,
as noted above, that Japan has been continually lending abroad and
increasing its positive debt service balance. The trend in Japan's
real exchange rate with respect to the United States has been downward.
If that reflects a similar downward trend in the real exchange rate
with the rest of the world, the evidence is consistent with continual
rightward shifts of the vertical SI line that are unmatched by rightward
shifts in the BT curve.
Time again for a test! Be sure and think up your own answers before looking at the ones provided.
Choose Another Topic in the Lesson